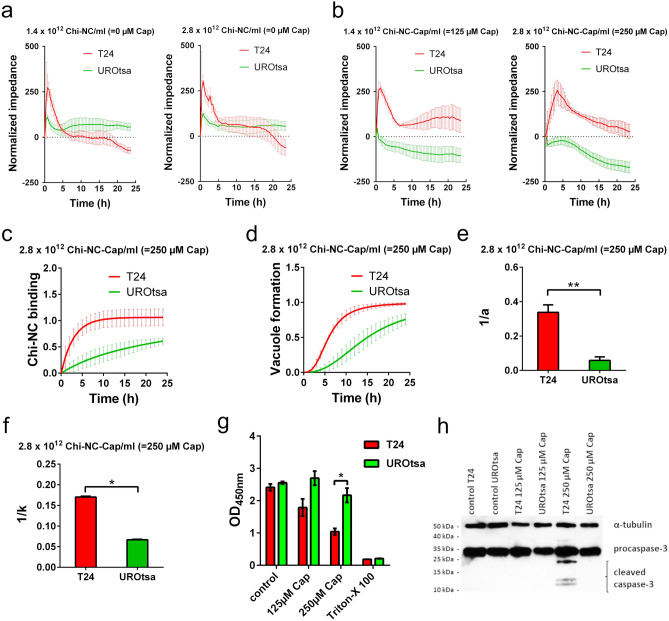
Figure 5.
Impedance measurements of T24 and UROtsa cells following treatment with capsaicin-loaded or empty Chi-NCs. (a) Control experiments with empty Chi-NCs (no capsaicin) at indicated nanoparticle concentrations (2.8 × 10¹² and 1.4 × 10¹² particles mL−1). Data are presented as mean ± SD (n = 4). (b) Treatment with capsaicin-loaded Chi-NCs (Chi-NC-Cap) at indicated concentrations (2.8 × 10¹² particles mL−1 = 250 µm capsaicin, and 1.4 × 10¹² particles mL−1 = 125 µm capsaicin). The response of T24 cells was more pronounced than that of UROtsa cells. Data are presented as mean ± SD (n = 4). (c) Binding of Chi-NC-Cap as a function of time (2.8 × 10¹² particles mL−1 = 250 µm capsaicin). Data are presented as mean ± SD (n = 3). (d) Vacuole formation as a function of time upon treatment with Chi-NC-Cap (2.8 × 10¹² particles mL−1 = 250 µm capsaicin). Data are presented as mean ± SD (n = 3). (e) Derived from (c), ability of cells to bind Chi-NC-Cap (a−1). Data are presented as mean ± SD (n = 3, **p < 0.01). (f) Derived from (d), ability of T24 and UROtsa cells to deposit capsaicin in vacuoles (k−1). Data are presented as mean ± SD (n = 3, *p < 0.05). (g) Viability of Chi-NC-Cap treated T24 and UROtsa cells (2.8 × 10¹² particles mL-1 = 250 µm capsaicin, and 1.4 × 10¹² particles mL−1 = 125 µm capsaicin) was measured by WST-1 assay. RPMI-1640 medium (control) and 1% v/v Triton-X 100 were used as reference. Data are presented as mean ± SD (n = 3, *p < 0.05) (h) Detection of procaspase-3, cleaved caspase-3 and α-tubulin by western blot in lysates of cells treated with Chi-NC-Cap (1.4 × 10¹² particles mL−1 = 125 µm capsaicin and 2.8 × 10¹² particles mL−1 = 250 µm capsaicin). The unprocessed western blot image is shown in Supplementary Fig. S7.

