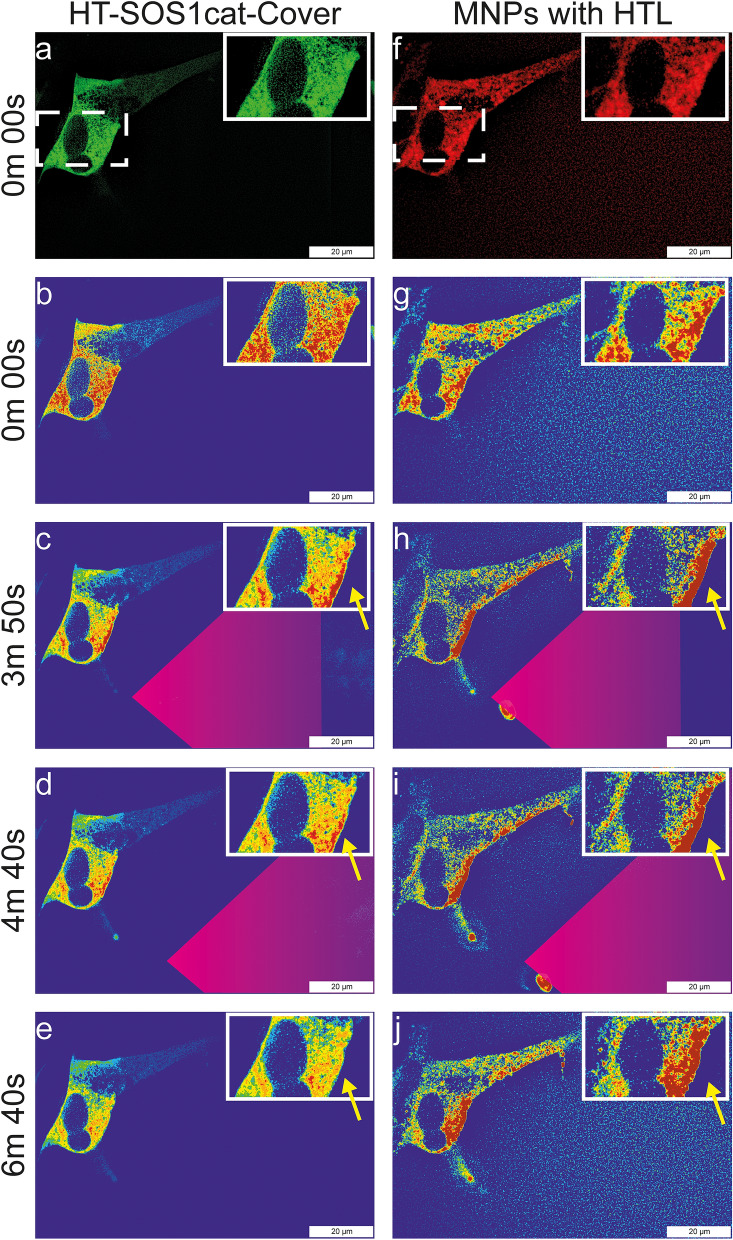
Figure 4.
Magnetic manipulation of HT-SOS1cat-Clover-transfected SH-SY5Y cells upon the injection of HTL-MNPs. The fluorescence of HT-SOS1cat-Clover is shown in the left column (Supplementary Video S5), and the fluorescence of the HTL-MNPs is shown in the right column (Supplementary Video S6). For better visualization of the corresponding fluorescence intensities, a rainbow color scheme was applied, with red corresponding to high, yellow to medium, and blue to low fluorescence intensities (for HT-SOS1cat-Clover: Supplementary Video S7; for HTL-MNPs: Supplementary Video S8). The insets show magnifications of the ROI. (a,b) At 0 min 00 s, HT-SOS1cat-Clover was distributed homogeneously in the cytoplasm. (f,g) HTL-MNPs were slightly accumulated on the left and right sides of the nucleus of the cell in the ROI. (h) At 3 min 50 s, HTL-MNPs were attracted towards the magnetic tip and accumulated at the proximal plasma membrane. (c) Similar behavior was seen for HT-SOS1cat-Clover, although the change in fluorescence intensity was weaker. (i,d) When the tip was moved at 4 min 40 s, HTL-MNPs moved into the small neurite and an increase of HT-SOS1cat-Clover fluorescence was observed. (j,e) After the tip was removed, HTL-MNPs and HT-SOS1cat-Clover began to diffuse in the next two minutes. Scale bars correspond to 20 µm.

