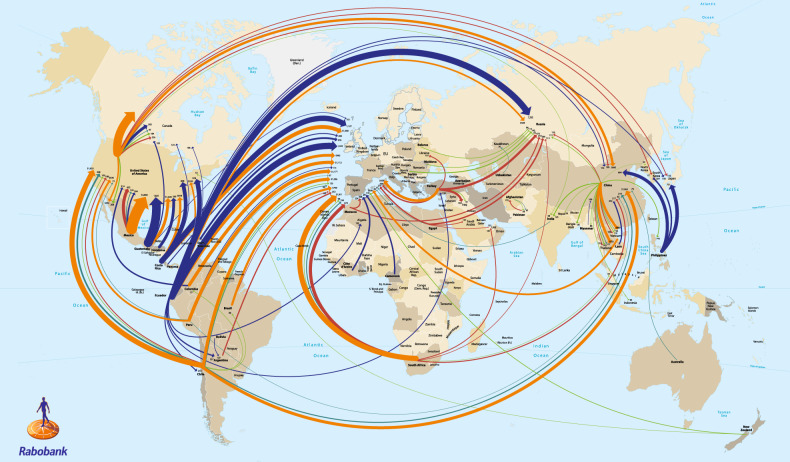
Fig. 1. Map of the global trade of fruit in 2016.
An estimated 80% of all fruits grown globally are sold as whole fresh fruit. Key to colored lines: orange—trade movement and monetary value of total fresh fruit, excluding nuts and frozen fruit. Other lines illustrate commodity volume. Blue—bananas and plantains; green—apples; aquamarine—grapes; red—citrus. The minimum requirement for trade values to be shown is USD 500 million, while for commodity volume, it was bananas, plantain, and citrus—100,000 tons and for apples and grapes—50,000 tons. Line thickness proportional to the magnitude of the trade. Source: van Rijswick273 RaboResearch, The Netherlands. Reproduced with the kind permission of RaboResearch

