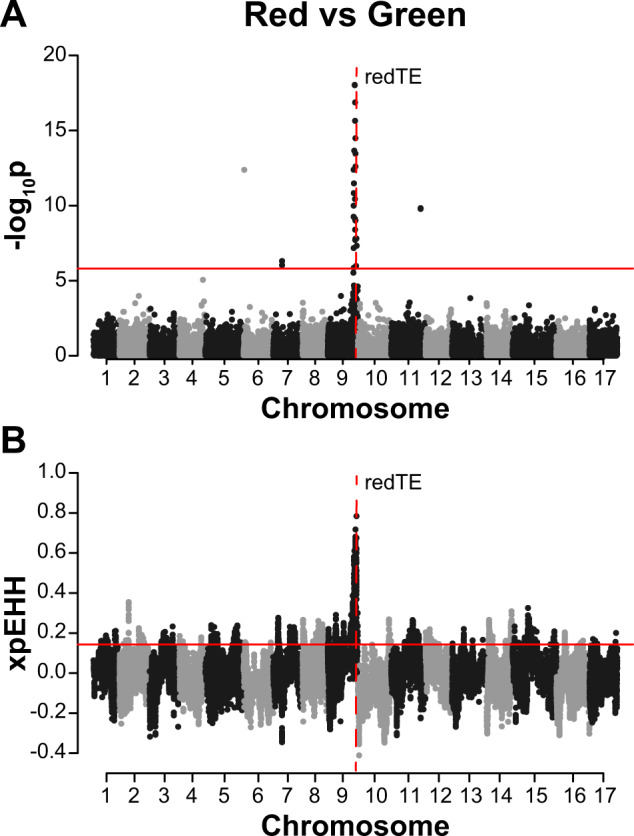
Fig. 6. GWAS and XP-EHH selection scan for apple skin colour. Dashed vertical lines indicate the location of the redTE retrotransposon just upstream of the MYB1 gene, a known key regulator of apple skin colour.

A Manhattan plot of GWAS results for fruit colour. p-values are log-transformed and the horizontal line indicates a Bonferroni-corrected p-value threshold for significance. B XP-EHH selection scan profiles comparing red and green accessions. Positive values indicate selection for red colour. The horizontal lines indicate the top 5% of values across the genome
