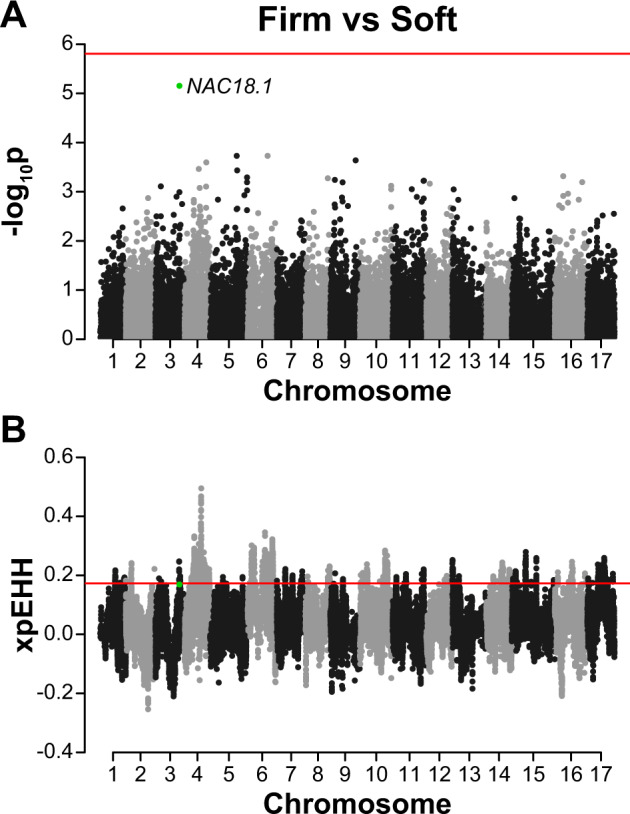
Fig. 7. GWAS and XP-EHH selection scan for fruit firmness.

The position of a previously identified SNP in NAC18.1 (D5Y) is indicated with a green dot. A Manhattan plot of GWAS results for fruit firmness. p-values are log-transformed and the horizontal line indicates a Bonferroni-corrected p-value threshold for significance. B XP-EHH selection scan comparing soft and firm accessions. Positive values indicate selection for firmer apples. The horizontal lines indicate the top 5% of values across the entire genome
