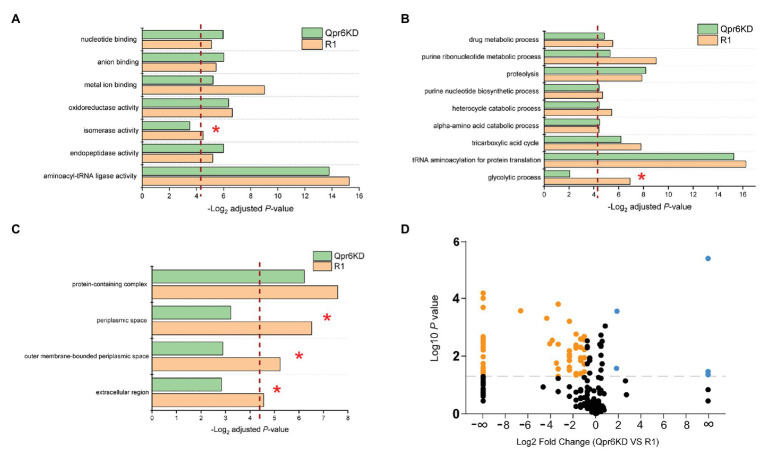
Figure 4.
Effects of Qpr6 on the periplasmic protein transport in D. radiodurans. (A–C) Gene Ontology enrichment analysis of periplasmic-associated proteins in R1 and Qpr6 KD based on molecular function (A), biological processes (B), and subcellular location (C). The pathways that are not significantly enriched in Qpr6 KD are indicated with asterisks. The red dashed line shows the threshold of significance (p ≤ 0.05). (D) Volcano plot showing the differential expressed proteins in the periplasmic space of Qpr6 KD compared to R1. Black spots represent the proteins showing no significantly differential expressions. Orange spots represent the proteins showing significant lower abundance in Qpr6 KD compared to R1. Light blue spots represent the proteins showing significant greater abundance in Qpr6 KD compared to R1. The gray line shows the threshold of significance (p ≤ 0.05).

