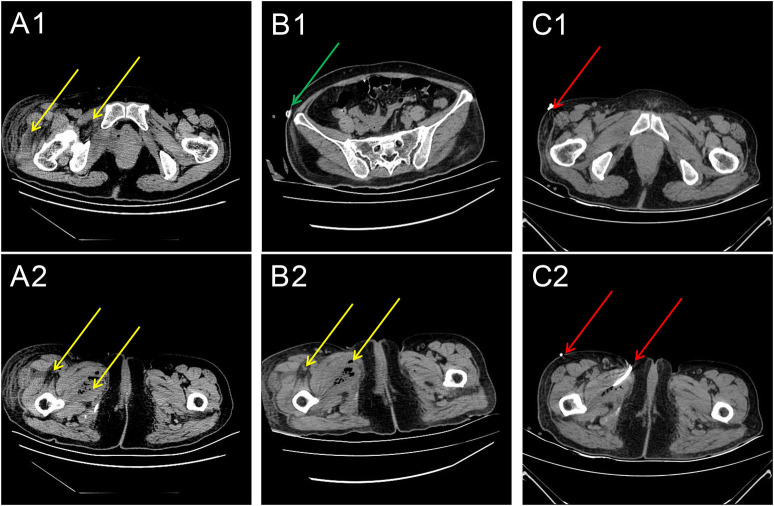
Figure 1.
Series of computed tomography (CT) images (A) 1 week, (B) 2 weeks, and (C) 3 weeks after the sling procedure. (A1,A2) The CT scans of the pelvis and thigh regions indicate that the pelvic floor and thigh root muscle cavities have multiple gas shadows (yellow arrows). (B1,B2) The CT scans of the pelvis and thigh for assessing the infection status. The green arrows indicate the location of the drainage tube. The location of the gas (yellow arrow). (C1,C2) The CT scans of the pelvis and thigh for assessing the infection status. The red arrows indicate the location of the corrected drainage tubes. The location of the gas (yellow arrow).

