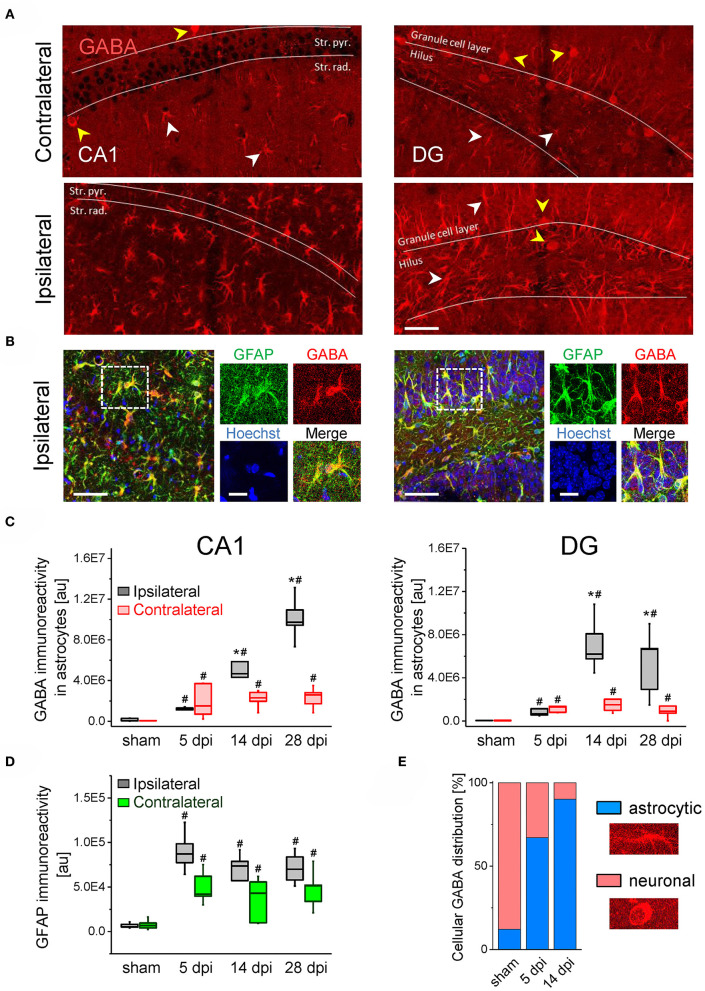
Figure 3.
GABA immunostaining in the ispi- and contralateral hippocampus of kainate injected animals. (A) Representative confocal images of GABA staining in the hippocampal CA1 region (left panels) and the dentate gyrus (DG, right). Scale bar = 50 μm, white and yellow arrowheads denote GABA immunoreactivity in astrocytes and neurons, respectively. (B) GABA (red), GFAP (green) and Hoechst (blue) triple staining in the ipsilateral CA1 region (left panels) and DG (right). Dashed boxes in the left panels indicate areas enlarged to the right. Scale bars = 50 μm (large panels) and 20 μm (blowups). (C) Quantifications of GABA immunoreactivity in GFAP-positive astrocytes in the CA1 region and dentate gyrus at different time points following kainate or sham injection. (D) Quantifications of GFAP immunoreactivity in the CA1 region. (E) Relative cellular distribution of ipsilateral GABA immunoreactivity in the DG. N = 5 slices from five animals for each condition and time point. Error bars represent SD. *significantly different from the contralateral side, #significantly different from sham (p < 0.05, stratified two-way ANOVA followed by Tukey's test and independent samples t-test per group).

