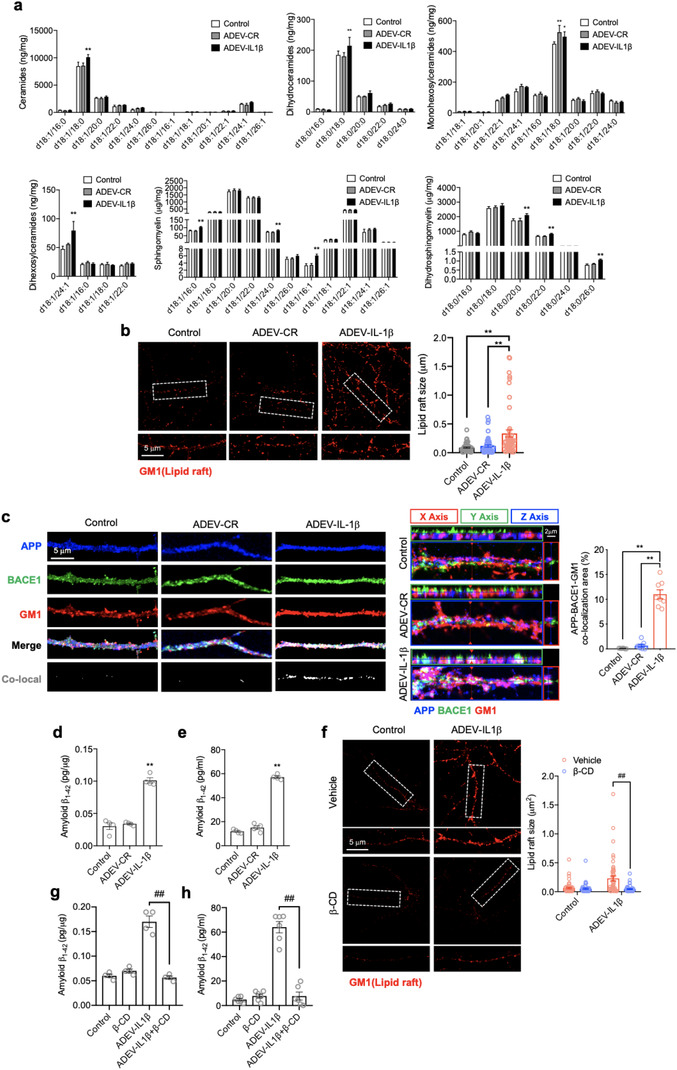
FIGURE 3.

Astrocyte derived EV‐IL‐1β up‐regulated neuronal APP amyloidogenic processing. Cultures were treated with vehicle (control), astrocyte derived EV‐CR (ADEV‐CR) or astrocyte derived EV‐IL‐1β (ADEV‐IL‐1β) for 24 h. (a) Ceramides, dihydroceramides, monohexosylceramides, dihexosylceramides, sphingomyelin and dihydrosphingomyelin were quantitatively measured by mass spectrometry. Data are mean ± SEM of n = 3–5 independent experiments per condition. *P < 0.05, **P < 0.01, one‐way ANOVA with Tukey post‐hoc comparisons. (b) Representative images showing cholera toxin submit B staining (labels GM1) in primary neurons and quantitation of lipid raft size following the indicated treatments. Data are mean ± SEM of n = 50 dendritic branches in each of three independent experiments. *P < 0.05, **P < 0.01, one‐way ANOVA with Tukey post‐hoc comparisons. (c) Representative immunofluorescent images of primary neurons stained with APP (blue), BACE1 (green), GM1 (red). Merged images show the co‐localization of APP, BACE1 and GM1 as white. Orthogonal views of Z‐stack images show protein co‐localization. Bar graph shows the quantitation of percent co‐localized area along dendritic branches. Data are mean ± SEM of n = 8. *P < 0.05, **P < 0.01, one‐way ANOVA. (d‐e) The differentiated SH‐SY5Y (10 μM retinoic acid treated for 7 days) were treated with astrocyte derived EV‐IL‐1β or astrocyte derived EV‐CR for 24 h. The concentration of whole cell lysis (d) and supernatant (e) of astrocyte derived EVs induced differentiated SH‐SY5Y amyloid β1‐42 were measured by human Aβ1‐42 ELISA. The graphs show mean ± SEM, n = 4. **P < 0.01, one‐way ANOVA with Tukey post‐hoc comparisons. (f‐h) Astrocyte derived EV‐IL‐1β companied with β‐cyclodextrin (10 μM) treated neurons for 24 h. The lipid raft size was measured by GM1 immunofluorescence (f), the graphs show mean ± SEM, n = 50. *P < 0.05, **P < 0.01, one‐way ANOVA with Tukey post‐hoc comparisons. The concentration of whole cell lysis (g) and supernatant (h) of differentiated SH‐SY5Y human amyloid β1‐42 were measured by ELISA. The graphs show mean ± SEM, n = 4‐6. ## P < 0.01, one‐way ANOVA with Tukey post‐hoc comparisons
