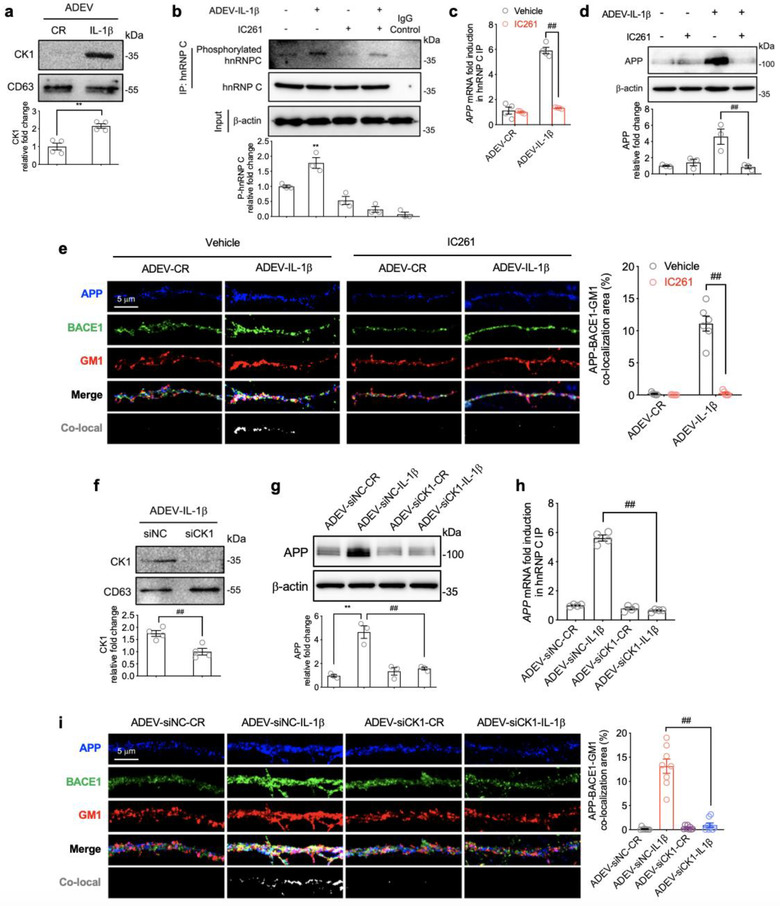
FIGURE 4.

CK1 carried in astrocyte derived EV‐IL‐1β promotes the phosphorylation and binding of hnRNP C to APP mRNA. (a) Representative Western blot and densitometric quantitation of CK1 protein expression in astrocyte derived EV‐CR (ADEV‐CR) and astrocyte derived EV‐ IL‐1β (ADEV‐IL‐1β). Data are mean ± SEM of n = 4 independent experiments per condition. **P < 0.01. Student's t‐test. (b) Representative Western blot and densitometric quantitation of total and phosphorylated hnRNP C from neurons treated with vehicle, astrocyte derived EV‐IL‐1β (50 EVs/neuron), the CK1 inhibitor IC261(30 μM), or astrocyte derived EV‐IL‐1β+IC261 for 6 h. Data are mean ± SEM of n = 3 independent experiments per condition. **P < 0.01, one‐way ANOVA with Tukey post hoc comparisons. (c) APP mRNA binding to hnRNP C measured by RT‐qPCR 6 h following the exposure of neurons to the indicated treatment conditions. Data are mean ± SEM of n = 4 independent experiments per condition. **P < 0.01, one‐way ANOVA with Tukey post hoc comparisons. (d) Representative Western blot and densitometric quantitation of APP from neurons treated with vehicle, astrocyte derived EV‐IL‐1β (50 EVs/neuron), the CK1 inhibitor IC261 (30 μM), or astrocyte derived EV‐IL‐1β+IC261 for 24 h. Data are mean ± SEM of n = 3 independent experiments per condition. **P < 0.01, one‐way ANOVA with Tukey post hoc comparisons. (e) Immunofluorescent images of dendritic branches showing APP (blue), BACE1 (green), GM1 (red) and the merged images. Co‐localized APP, BACE1 and GM1 are shown in white. Bar graph shows the quantitation of percent co‐localized area along dendritic branches. Data are mean ± SEM of n = 6 independent experiments per condition. ## P < 0.01, one‐way ANOVA with Tukey post‐hoc comparisons. (f) Representative Western blot and densitometric analysis of astrocyte derived EV‐IL‐1β isolated from astrocytes transfected with a small interfering non‐coding RNA (siNC) or siCK1. Data are mean ± SEM of n = 4 independent experiments per condition. ## P < 0.01. Student's t‐test. (g) Representative Western blot and densitometric quantitation of APP from neurons treated with astrocyte derived EV‐siNC‐CR (ADEV‐siNC‐CR), astrocyte derived EV‐siNC‐IL1β (ADEV‐siNC‐IL1β), astrocyte derived EV‐siCK1‐CR (ADEV‐siCK1‐CR), or astrocyte derived EV‐siCK1‐IL1β (ADEV‐siCK1‐IL1β). Data are mean ± SEM, n = 3 independent experiments per condition. **P < 0.01, ## P < 0.01. One‐way ANOVA with Tukey post hoc comparisons. (h) APP mRNA binding to hnRNP C measured by RT‐qPCR 6 h following the exposure of neurons to the indicated treatment conditions. Data are mean ± SEM of n = 4 independent experiments per condition. (i) Immunofluorescent images of dendritic branches 24 h following the indicated treatment conditions showing APP (blue), BACE1 (green), GM1 (red) and the merged images. Co‐localized APP, BACE1 and GM1 are shown in white. Bar graph shows the quantitation of percent co‐localized area along dendritic branches. Data are mean ± SEM of n = 8 independent experiments per condition. ## P < 0.01. One‐way ANOVA with Tukey post hoc comparisons
