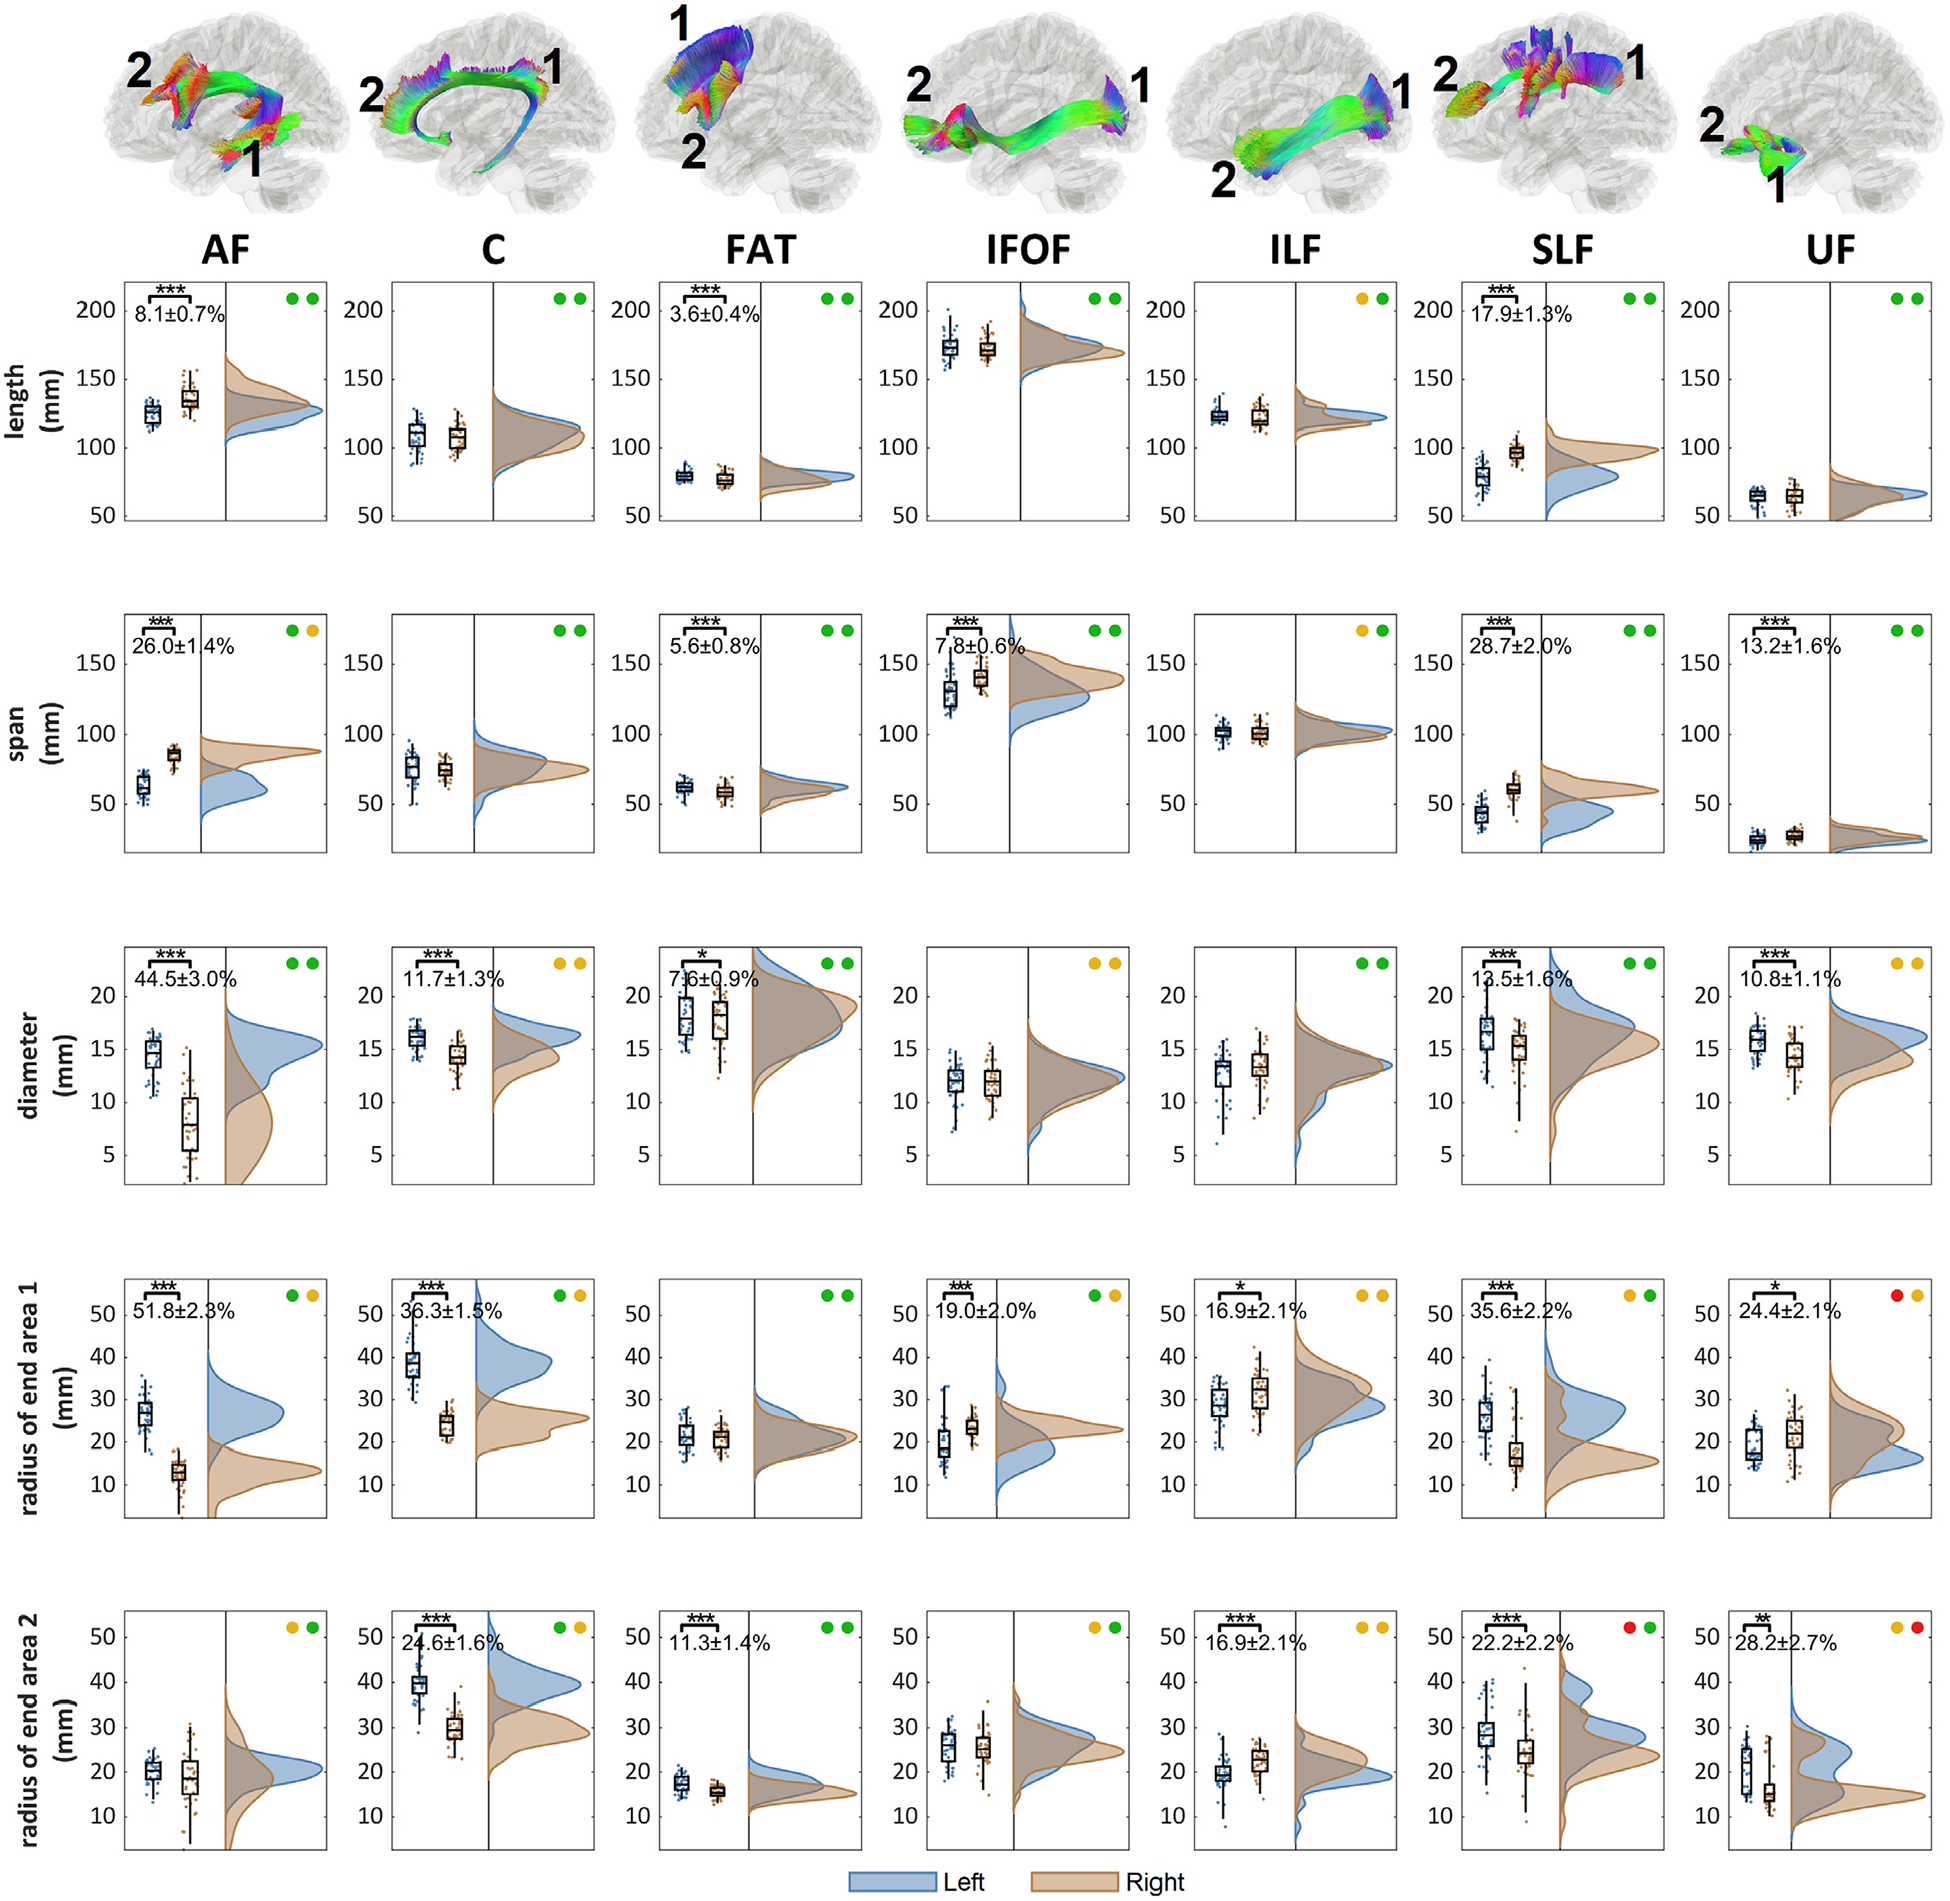
Fig. 5.

The distribution of the length metrics and their left-right differences in the association pathways. The location of the end surface 1 and 2 are annotated for each bundle. The association pathways present different significance level of the left-right differences (p-value: *** < 0.001, ** < 0.01, * < 0.05). The test-retest reliability of the metrics for the left and right bundle is presented by colored circles (green: ICC≥0.75, yellow: 0.75>ICC≥0.5, red: ICC<0.5). AF, C, FAT, SLF, and UF present an overall left dominance in either the diameter or radius, whereas IFOF and ILF present right dominance.
