
Fig. 7.
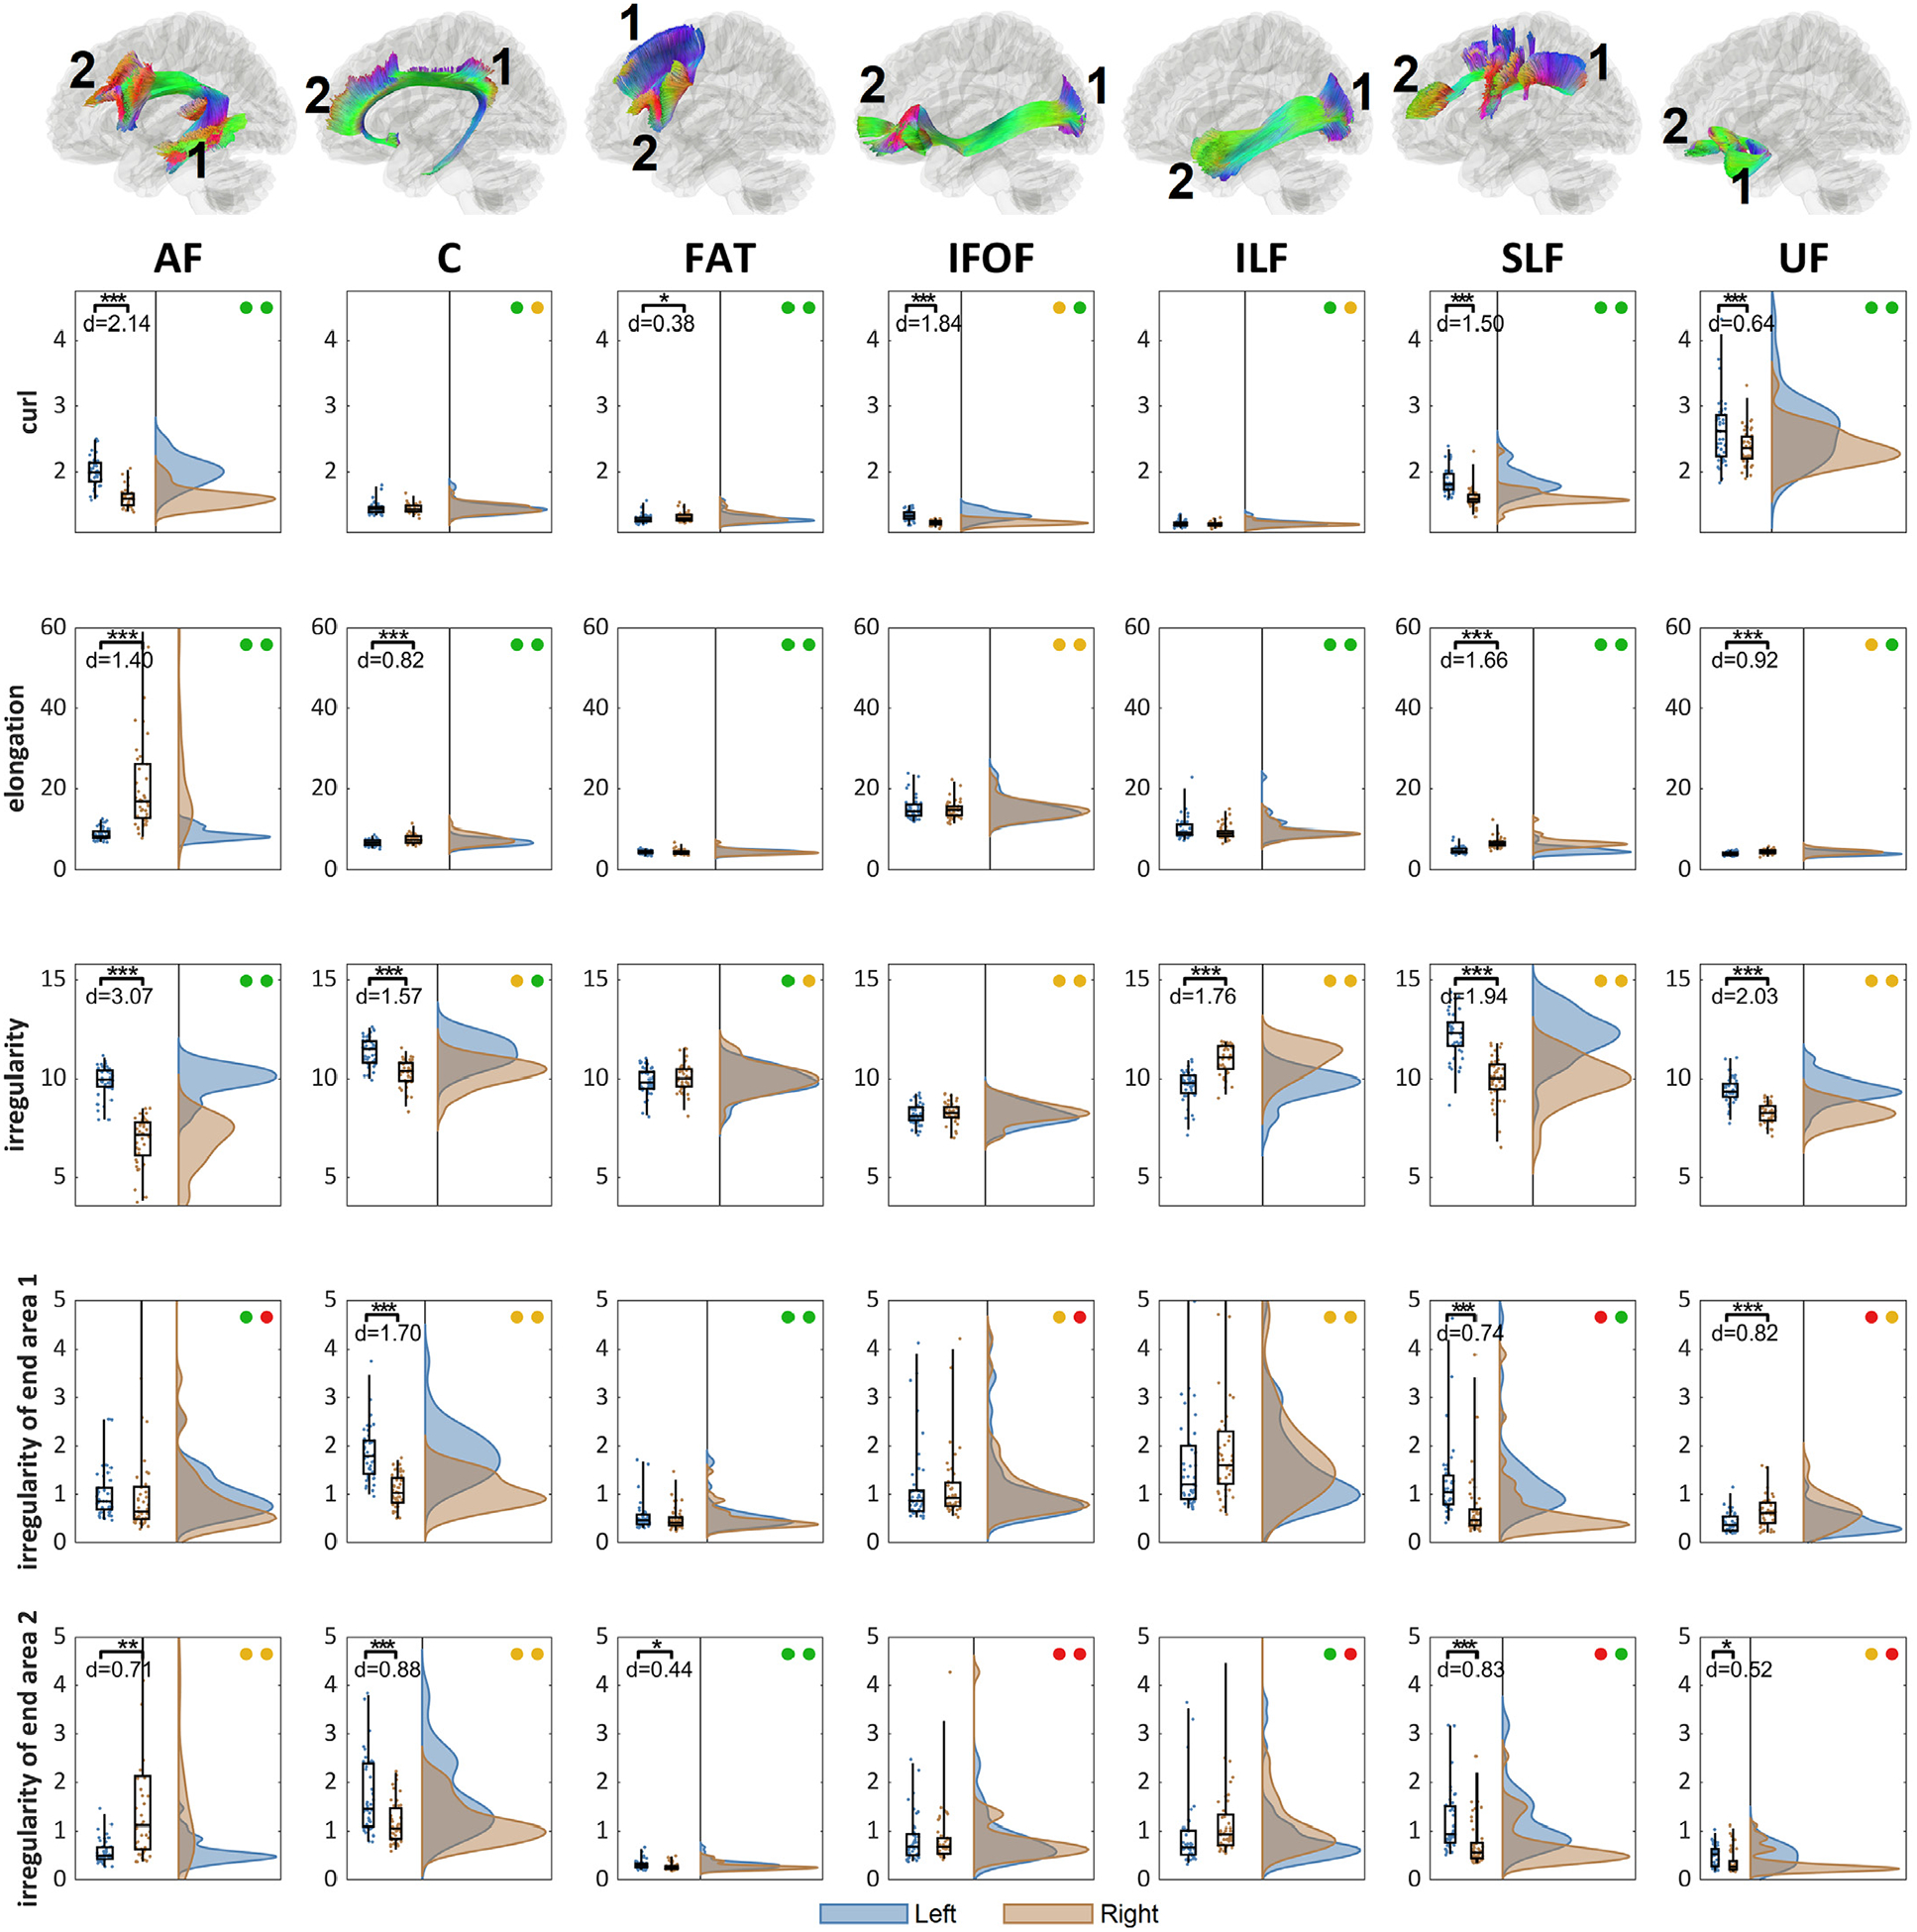
The distributions of the shape metrics and their left-right differences in the association pathways. The location of the end surface 1 and 2 are annotated for each bundle. The left-right differences are tested (p-value: *** < 0.001, ** < 0.01, * < 0.05) and effect size (Cohen’s d) with test-retest reliability presented as colored circles (green: ICC≥0.75, yellow: 0.75>ICC≥0.5, red: ICC<0.5). All pathways present significant lateralization at different shape metrics. The overall irregularity shows the large left-dominance at AF, C, SLF, UF, and right dominance at ILF, suggesting their prominent left-right differences in bundle topology.