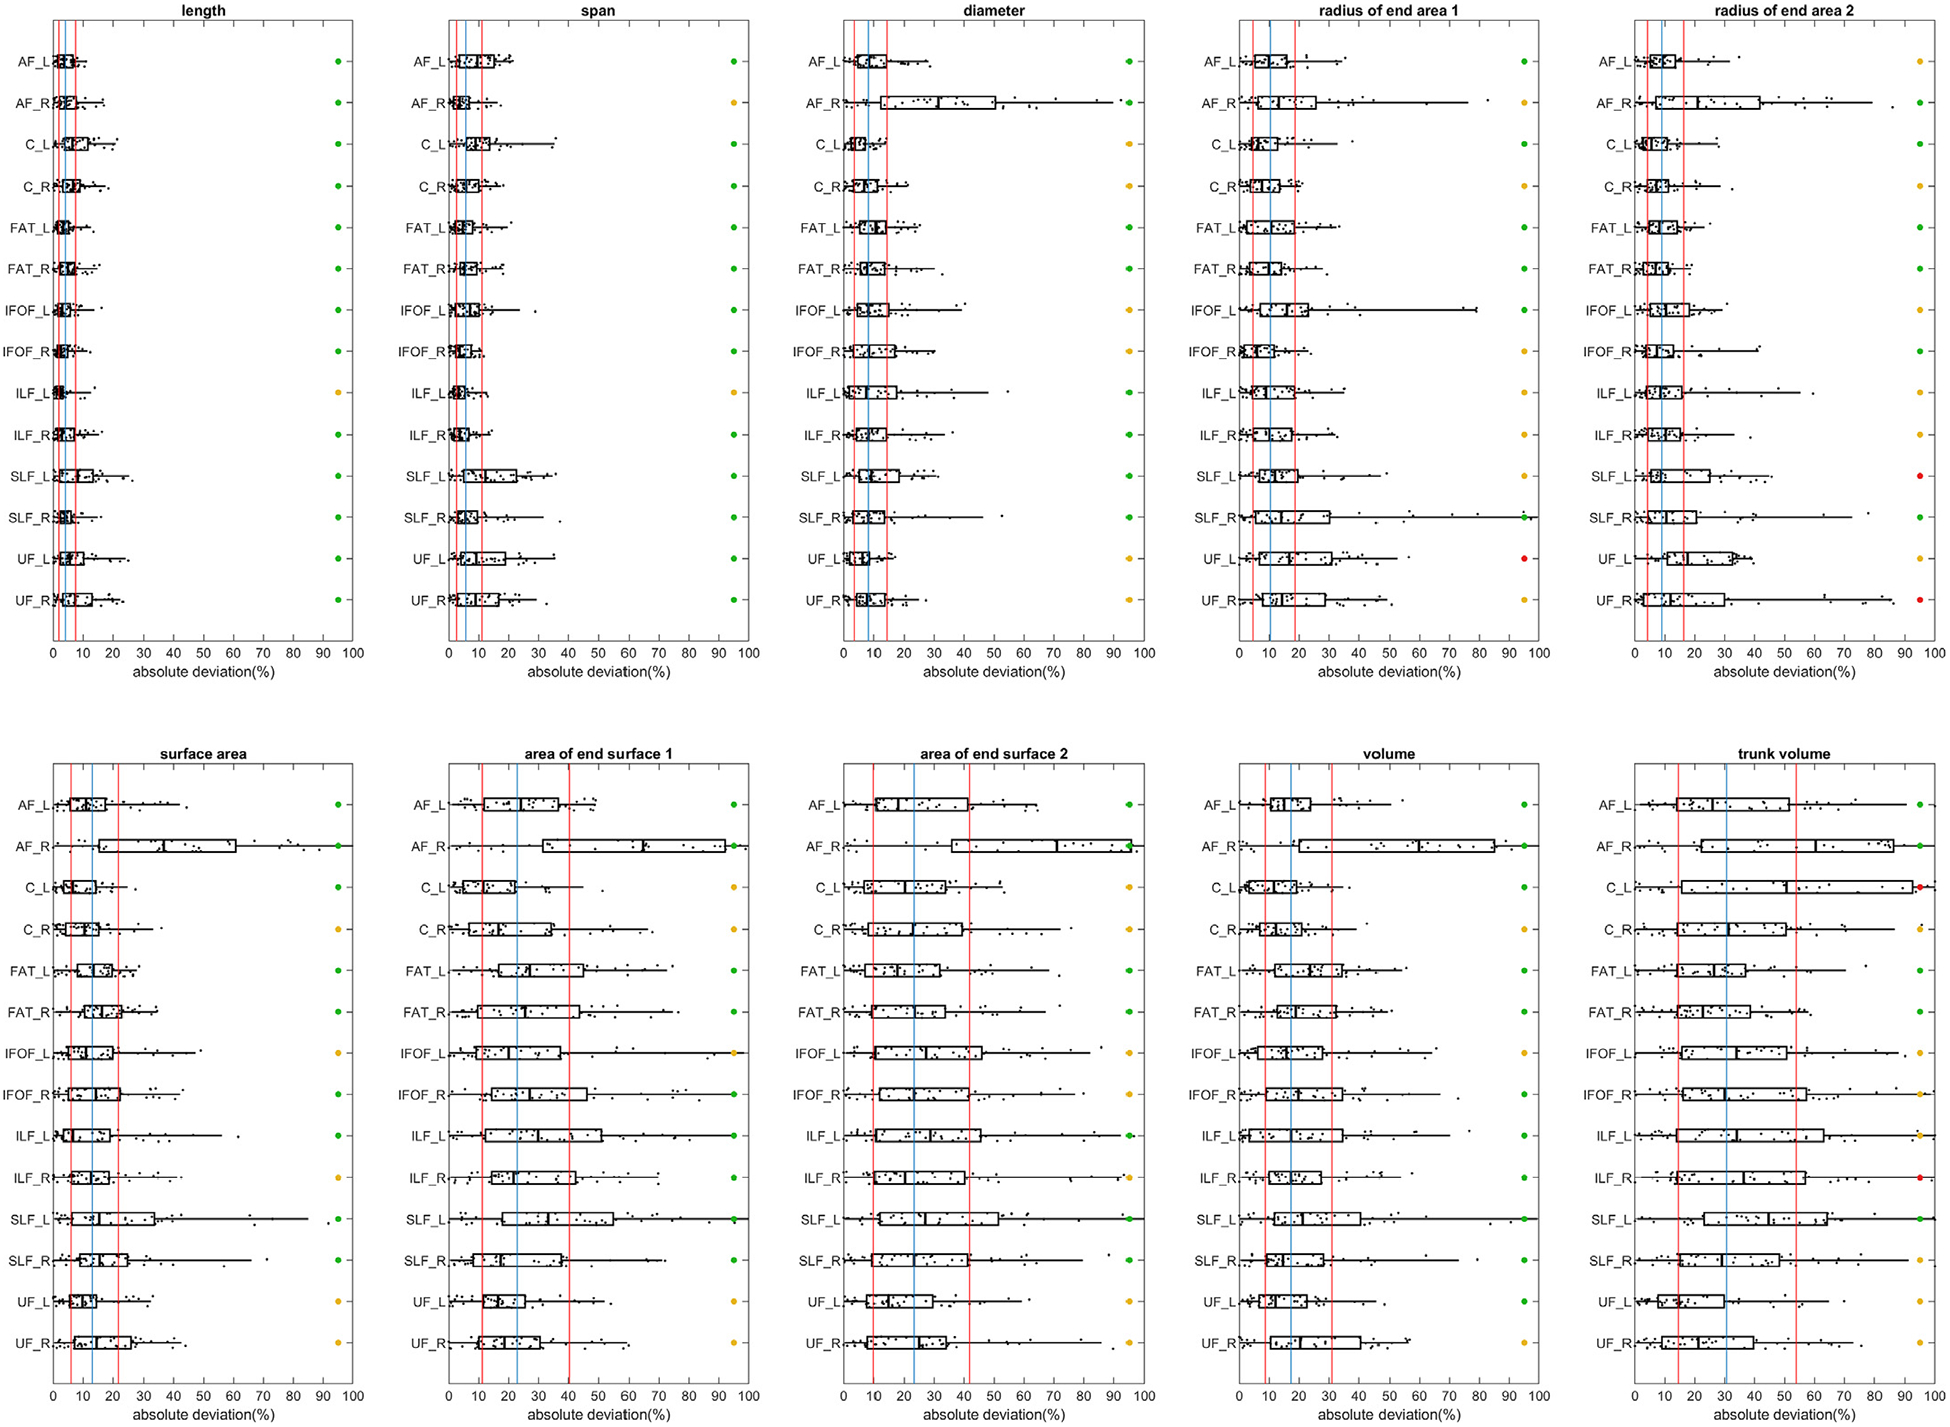
Fig. 8.

Between-subject variations of the length, area, and volume metrics in the association pathways. The variations are quantified by absolute deviation. The blue vertical line marks the median of deviation values of all bundles, whereas the two red vertical line marks the first and third quantiles. The test-retest reliability is labeled by colored circles (green: ICC≥0.75, yellow: 0.75>ICC≥0.5, red: ICC<0.5). All length metrics have relatively smaller between-subject variation, and the area and volume metrics show a slightly larger between-subject variation. The end surfaces show a greater deviation of more than 20%. The overall results suggest that the “layout” of the association pathways seems not to vary a lot across subjects, while the innervation region has a considerable between-subject variation.
