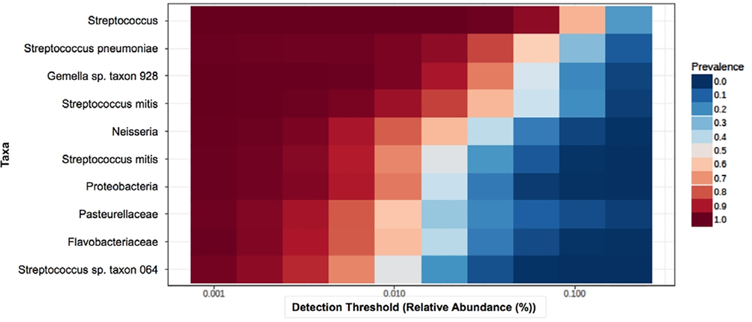
Figure 1.
The core oral microbiome. The 10 oral taxa with the highest transcriptional activity across all participants (n = 346) are shown. Relative abundance (x-axis) for all 10 taxa exceeded 0.5% of the oral microbiome, and each taxa was present in counts of 10 or more in at least 70% of samples (prevalence, shown in red-blue scale).

