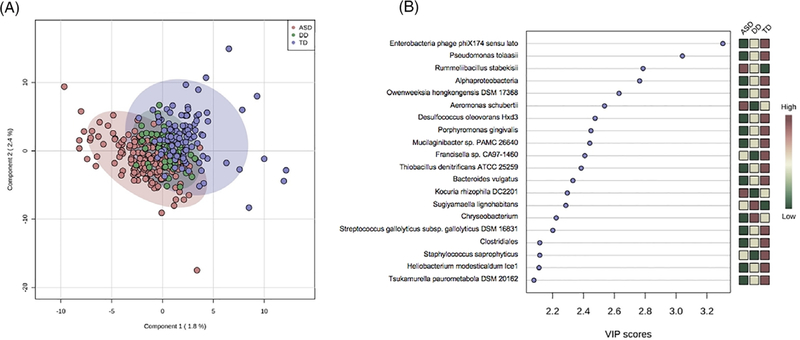
Figure 5.
Oral taxonomic profiles distinguish autism spectrum disorder (ASD) children from typically developing (TD) and developmental delay (DD) peers. A PLS-DA was used to visualize differences in taxonomic profiles at the species level between ASD, TD, and DD groups in two dimensions (A). A model accounting for 4% of the variance between groups resulted in partial separation of ASD participants (red) from TD (blue) and DD (green) peers. The 20 taxa most critical for group projection are shown, based on variable importance in projection score (B). The majority of these taxa (14) are reduced (green boxes) in ASD samples relative to TD and DD groups. Three taxa are elevated in ASD participants (red boxes) and three demonstrated intermediate expression patterns (yellow boxes).

