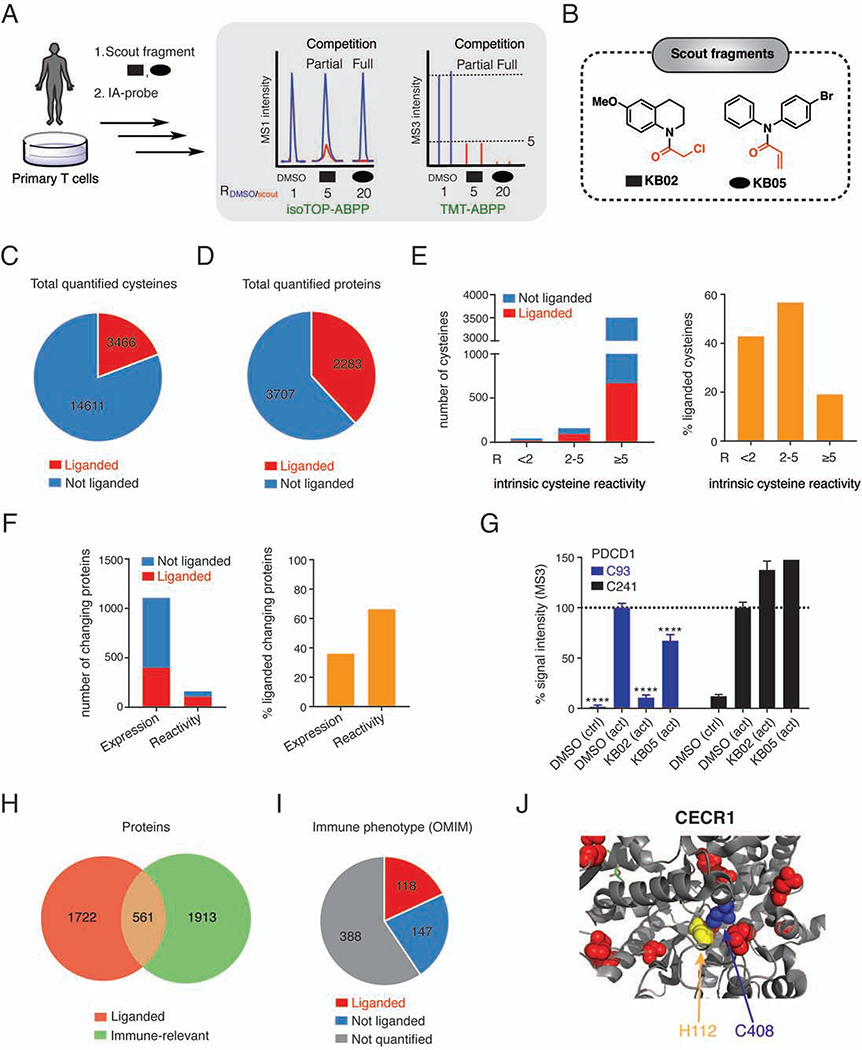
Figure 2. Chemical proteomic map of fragment electrophile-cysteine interactions in T cells.
(A) Workflow for chemical proteomic experiments measuring scout fragment engagement of cysteines in primary human T cells. See STAR Methods for more details.
(B) Structures of scout fragments KB02 and KB05. Red color indicates the reactive group for each fragment.
(C, D) Pie chart representations of cysteines (C) and proteins (D) liganded by scout fragments. Results were obtained by combining soluble and particulate proteomic data for KB02 and KB05 treatments (500 μM, 1 h) of both control and activated T cells. R-values within each group were derived from 3–5 independent isoTOP-ABPP and TMT-ABPP experiments.
(E) Total number (left) and percentage (right) of liganded cysteines per total number of cysteines quantified across the indicated intrinsic reactivity ranges, which were determined as described previously (Weerapana et al., 2010).
(F) Total number (left) and percentage (right) of liganded proteins with expression or reactivity changes in activated T cells.
(G) Quantification of cysteines in PDCD1, revealing elevated expression of this protein in activated T cells (increased intensity of DMSO (act) signals for C93 and C241) and scout fragment-sensitivity for C93. Error bars represent SD from 2–4 independent experiments. ****, p < 0.0001 compared to DMSO (act) group.
(H) Overlap of liganded proteins with immune-relevant proteins (Data S1).
(I) Fractions of liganded and quantified proteins from total proteins in OMIM database with immune phenotypes (Data S1, see STAR Methods for details).
(J) Location of liganded C408 (blue) and pathogenic missense mutations (yellow – mutation of H112, which is within 5 Å of C408, red – other mutations) in structure of adenosine deaminase CECR1 (PDB: 3LGD).

