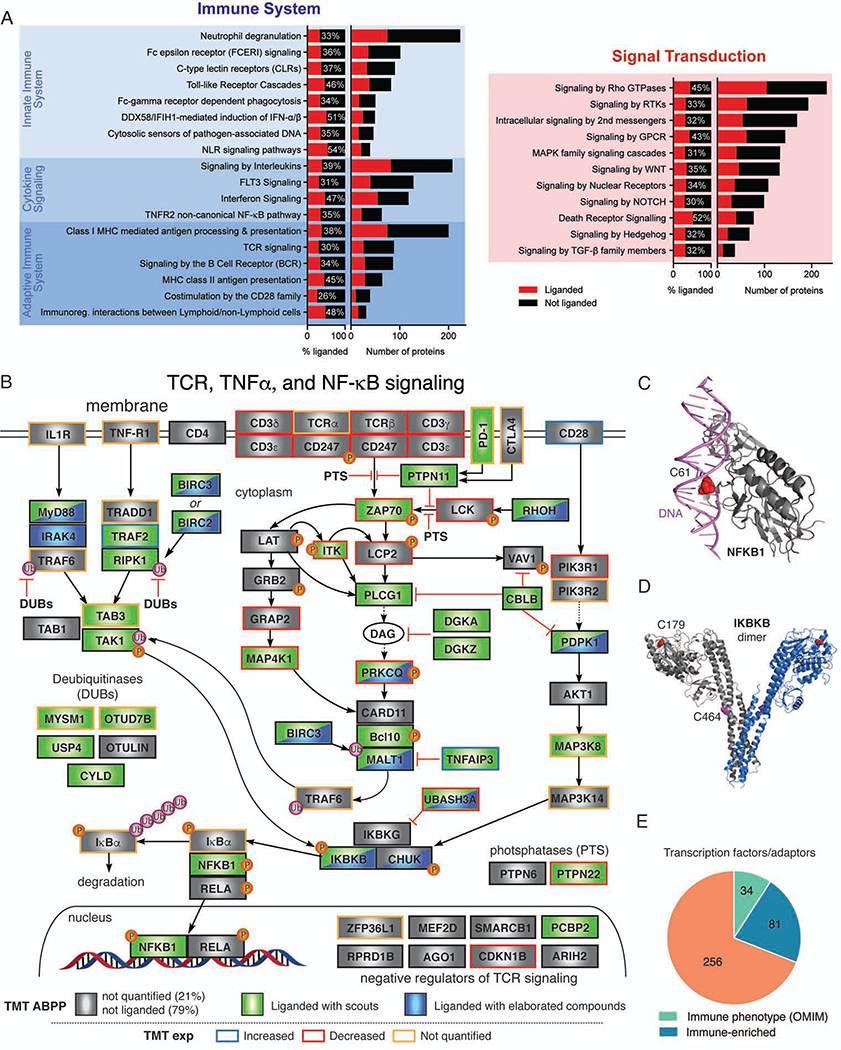
Figure 3. Liganded cysteines in immune-relevant proteins.
(A) Ligandability analysis of Reactome pathways within Immune System (left, hierarchical level 2 grouped according to their parent nodes) or Signal Transduction (right, hierarchical level 2) categories. Liganded and quantified proteins are colored red and black, respectively. Also see Data S1.
(B) Diagram of TCR, TNF-alpha and NF-κB pathways marking proteins that possess cysteines liganded by scout fragments (green) or elaborated electrophilic compounds (blue). The rectangular frame around each protein is colored to reflect expression changes (blue, >2 fold, red, <2 fold, and black, unchanged, in activated T cells; yellow not quantified).
(C) Location of a liganded C61 at the DNA-binding interface of NFKB1 (CPDB: 2O61).
(D) Location of liganded active-site (C179) and non-active site (C464) cysteines in IKBKB (PDB: 4E3C).
(E) Fractions of liganded transcription factor and adaptor proteins that are also immune-relevant; Data S1.

