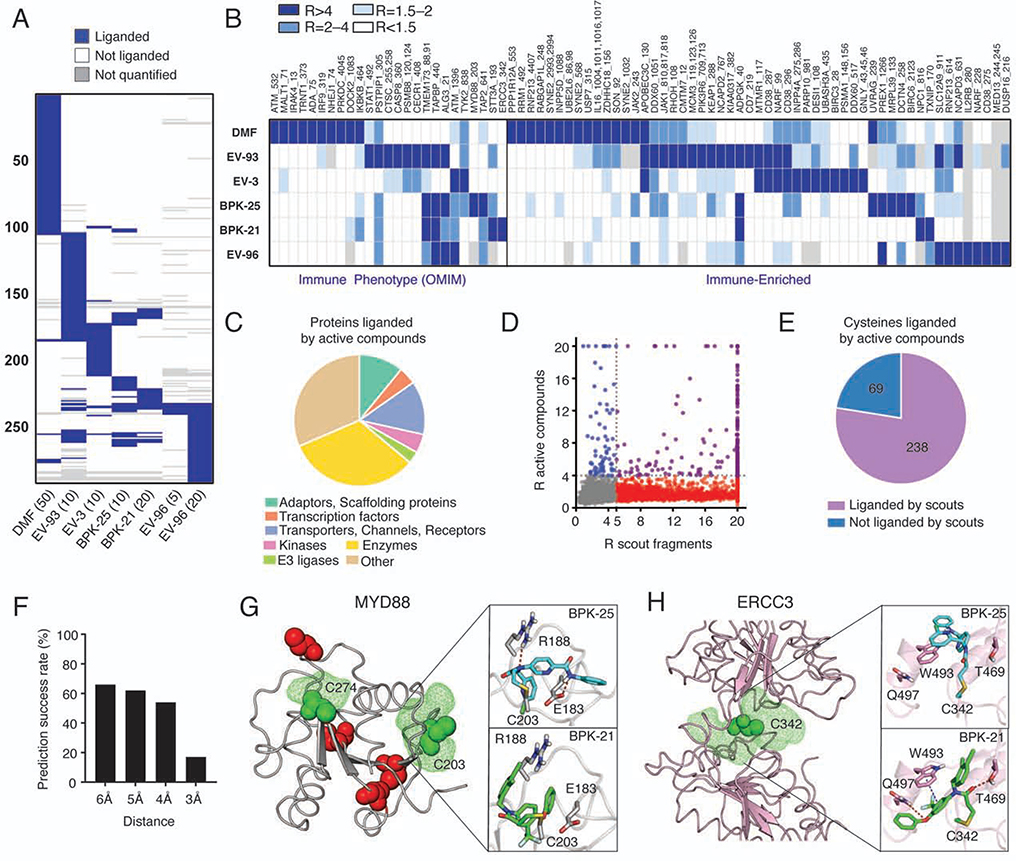
Figure 5. Cysteines liganded by active compounds in human T cells.
(A) Heatmap showing liganded cysteines for active compounds in human T cells (treated with the indicated concentrations of compounds (μM) for 3 h followed by ABPP). Cysteines quantified for at least two active compounds with R values ≥4 (DMSO/compound) for at least one of the compounds are shown. Results were obtained by combining isoTOP-ABPP and TMT-ABPP data from 2–6 independent experiments. See STAR Methods for details.
(B) Heatmap showing cysteines liganded by active compounds in immune-relevant proteins.
(C) Distribution of protein classes containing cysteines liganded by active compounds.
(D, E) Comparison of cysteines liganded by active compounds versus scout fragments in human T cells, as displayed in correlation plot (D) and pie chart (E) analyses. In (D), cysteines liganded by both active compounds and scout fragments, only by active compounds, and only by scout fragments are showing in purple, blue, and red, respectively.
(F) Prediction success rate querying for pockets within the indicated distances from cysteines liganded by active compounds.
(G) Modeling of active compound interactions with C203 in MYD88 (PDB 4DOM). Predicted pockets highlighted as green mesh and other cysteines in the structure are colored red. Docking shows preferential liganding by BPK-25 due to predicted hydrogen bonds with E183 and R188 (top), which are not accessible in docked structure of BPK-21 (bottom).
(H) Modeling of active compound interactions with C342 of ERCC3 (PDB 5OF4). Docking shows preferential liganding by BPK-21 (bottom) due to predicted hydrogen bonds with T469 and Q497 and π−π interaction with W493, which are less accessible in the docked structure of BPK-25 (bottom).

