
Figure 3. The Cdc15 F-BAR Domain Cytosolic Face Has Functions in Addition to Scaffolding Cdc12.
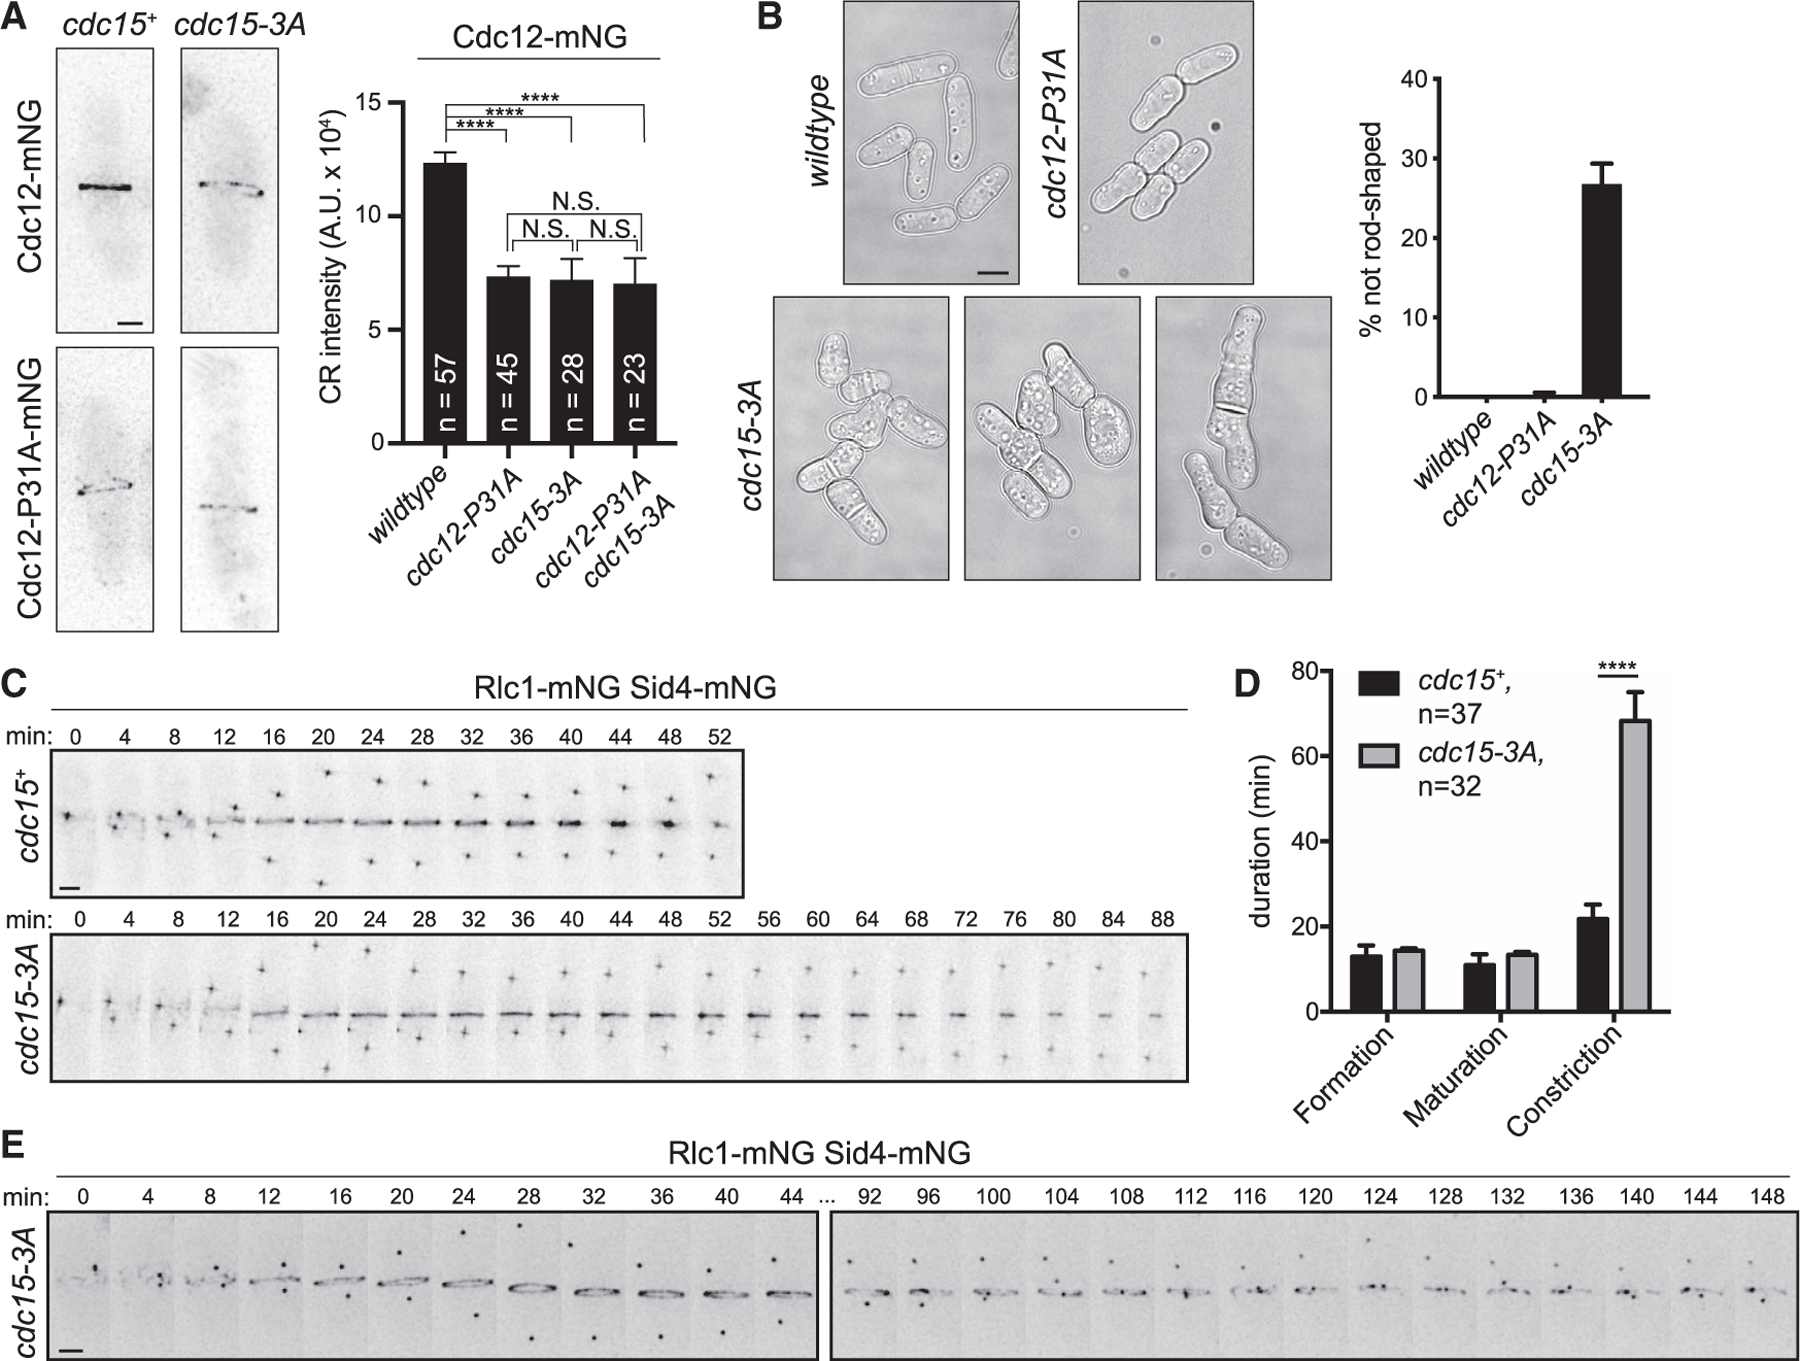
(A) Left: representative live-cell images; deconvolved max projections are shown. Right: quantification of mean Cdc12-mNG CR intensity. Error bars represent SEM. ****p < 0.0001, ***p < 0.001, NS, not significant; p > 0.99; one-way ANOVA with Tukey’s post hoc test for multiple comparisons. Total number of cells (n) from three experiments is indicated. Scale bar = 2 µm.
(B) Left: DIC images of the indicated strains grown at 25°C. Single Z slices are shown, and scale bar = 5 µm. Right: quantification of morphology defects in indicated strains. Wild type, n = 305 cells; cdc12-P31A, n = 341 cells; cdc15-3A, n = 436 cells; three experiments, error bars = SEM.
(C) Representative montages from time-lapse imaging. Minutes elapsed since spindle pole body separation are indicated. Max projections are shown. Scale bar = 2 µm. (D) Quantification of the mean duration of CR events, related to (C). ****p < 0.0001, Student’s t test. Error bars represent SEM, and number of cells analyzed (n) is indicated.
(E) Example montage of cdc15-3A cell with aberrant CR constriction. Ellipses denote frames removed for space, and max projections are shown. Scale bar = 2 µm.