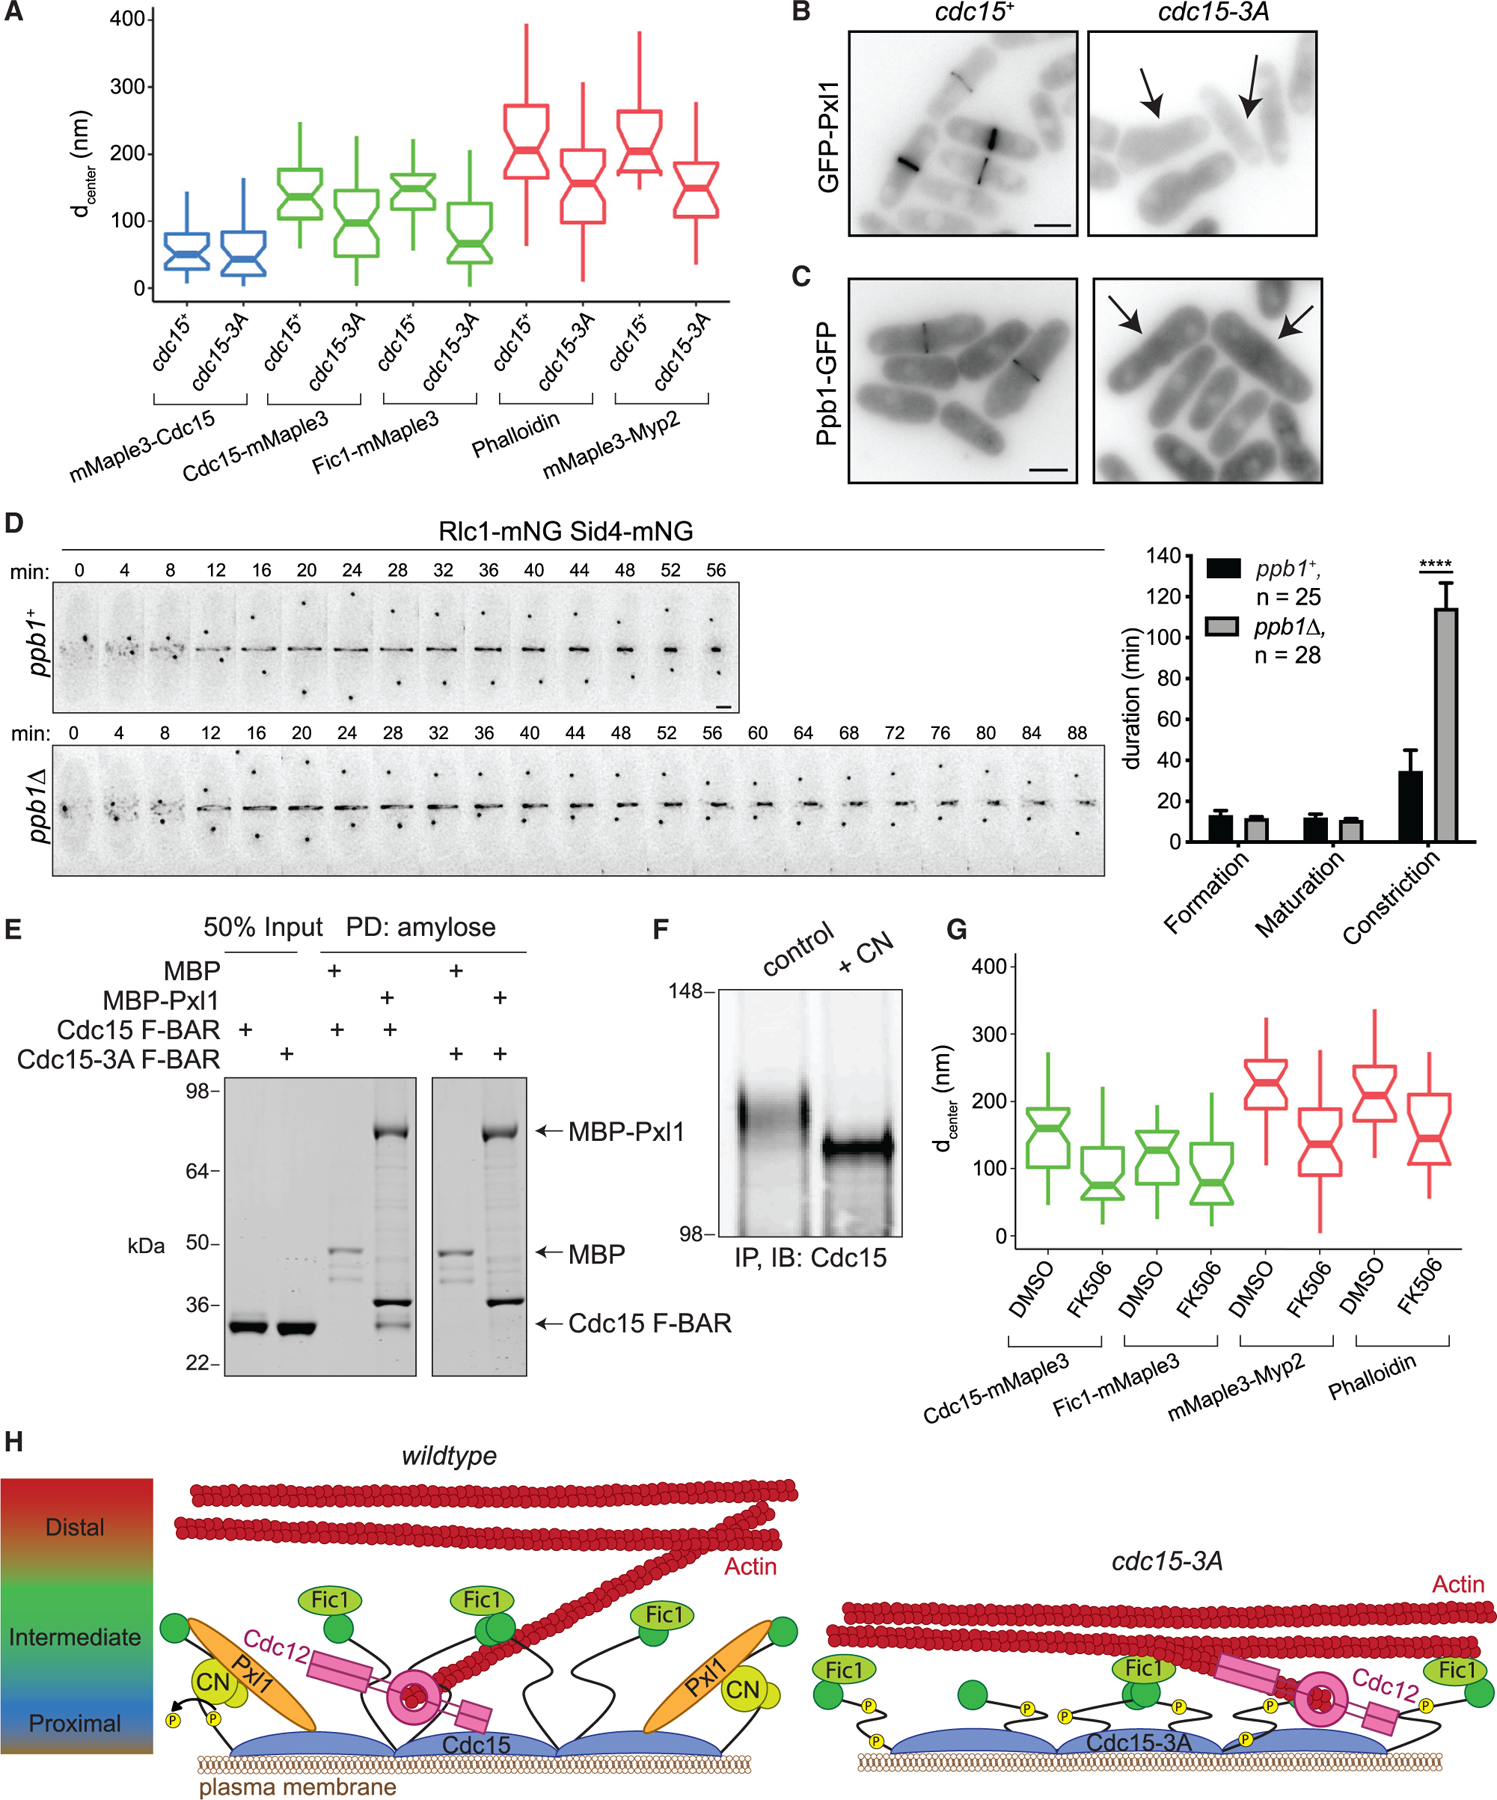
Figure 4. The Cdc15 F-BAR Domain Coordinates Other Binding Partners Required for Proper CR Architecture.

(A) Distance from the PM (dcenter) of the indicated CR components calculated from fPALM. Components of the CR membrane-proximal layer are in blue, intermediate in green, and distal in red. Boxplots depict first and third quartiles and median; whiskers, minimum and maximum; notches, 95% confidence intervals. See also Table S4.
(B and C) Representative images of GFP-Pxl1 (B) and Ppb1-GFP (C). Sum projections are shown, and scale bars = 5 µm. Arrows indicate cells without CR signal.
(D) Left: representative time-lapse montages. Minutes elapsed since spindle pole body separation are indicated; deconvolved max projections are shown. Scale bar = 2 µm. Right: quantification of the mean duration of CR events, ****p < 0.0001, Student’s t test. Error bars represent SEM, and number of cells analyzed (n) is indicated.
(E) Coomassie-stained SDS-PAGE of proteins PD with amylose resin after in vitro binding assay. Both F-BAR constructs also contain E30K E152K mutations. Experiment was repeated with similar results.
(F) Immunoblot (IB) of Cdc15 after immunoprecipitation (IP) from asynchronous cells and treatment with either a control or recombinant calcineurin (CN) phosphatase reaction. Numbers indicate position of molecular weight markers in kDa. Experiment was repeated with similar results.
(G) Distance from the PM (dcenter) of the indicated CR components in cells treated with DMSO or FK506, as in (A). See also Table S4.
(H) Model for the role of the Cdc15 F-BAR domain in driving nanoscale architecture of the CR. Left: the Cdc15 F-BAR domain recruits the formin Cdc12, but also Pxl1, which is required for CN localization. CN dephosphorylates Cdc15 to promote its open conformation. Right: in cdc15-3A, the protein network established by the Cdc15 F-BAR domain is disrupted, resulting in a shallower CR. Model not drawn to scale.
