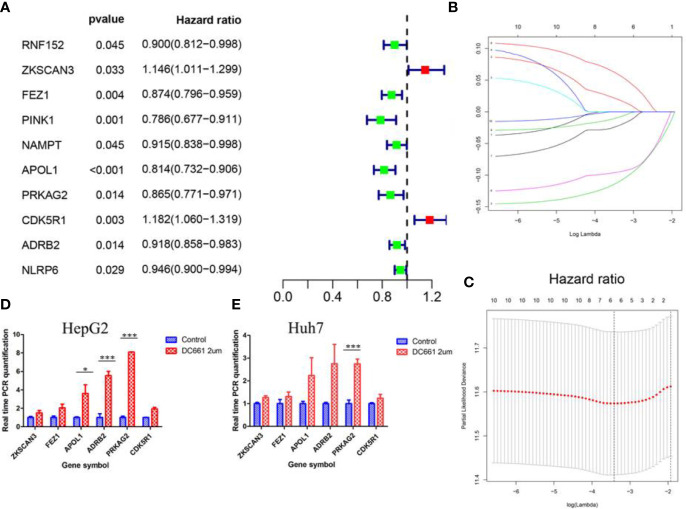
Figure 2.
The process of Lasso regression model construction. (A) Forest plot of the univariate Cox regression analysis in autophagy-related genes. (B, C) Establishment of the Lasso regression model. The expression of the six genes (FEZ1, APOL1, PRKAG2, ADRB2, ZKSCAN3, and CDK5R1) that constituted the model was higher in the autophagy inhibitor (DC661)-treated groups than in the control groups for the HepG2 (D) and Huh7 (E) cell lines. *p < 0.05; **p < 0.01; ***p < 0.001.

