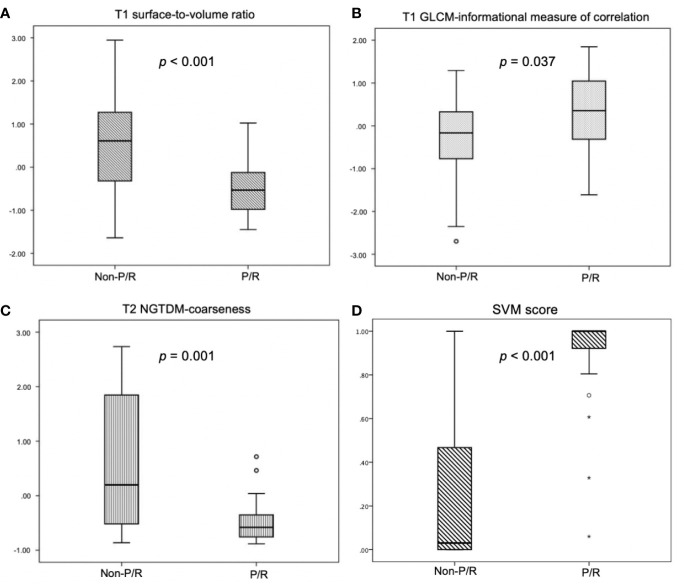
Figure 3.
Box plot of (A) T1 surface-to-volume ratio, (B) T1 GLCM-informational measure of correlation, (C) T2 NGTDM-coarseness, and (D) SVM score for prediction of P/R in NFPAs. Statistically significant differences (p < 0.05) (Mann-Whitney U test) in the selected features and SVM score are observed. Boxes indicate the interquartile range (IQR), and whiskers indicate the range. The horizontal line represents the median in each box. Circles represent outliers, which are defined as distances greater than 1.5 times the IQR below the first quartile or above the third quartile. Stars represent extreme values, defined as distances greater than three times the IQR below the first quartile.

