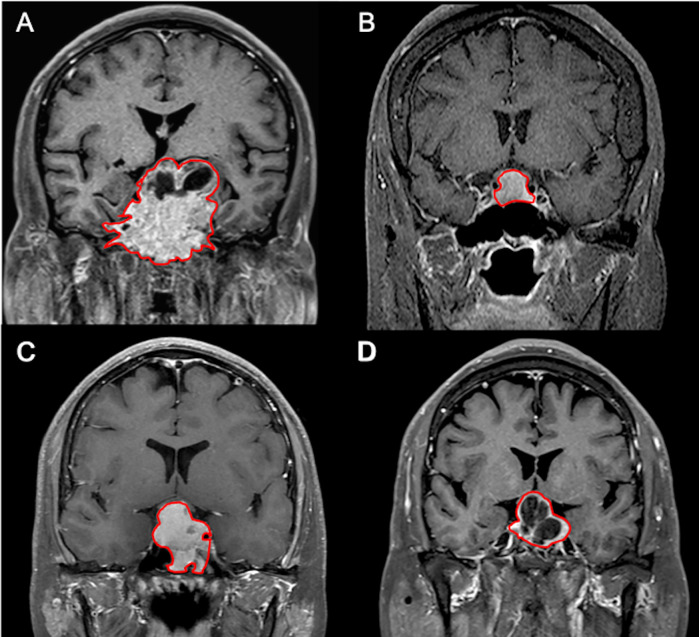
Figure 4.
Examples of NFPAs (red outline) on coronal CE T1WI showing (A) true positive (TP), (B) true negative (TN), (C) false positive (FP), and (D) false negative (FN) results in the prediction model. (A) In the TP group, larger tumor sizes with more surrounding bone invasion are observed. (B) In contrast, smaller tumor sizes without bone invasion are found in most TN cases. (C) Most FP cases showed relatively homogeneous contrast enhancement without apoplexy or cystic change. (D) Two of the three FN cases exhibit macrocystic components or apoplexy.

