FIGURE 3.
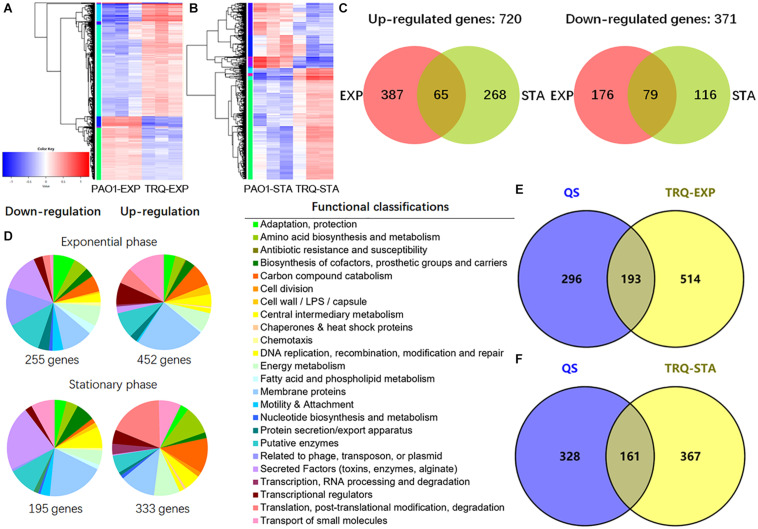
Transcriptome analyses of TRQ-treated P. aeruginosa cells. (A) Hierarchical clustering and heatmap analysis of the differentially expressed genes of TRQ-treated P. aeruginosa cells under exponential growth phase analysis (PAO1-EXP vs. TRQ-EXP) and stationary growth phase (PAO1-STA vs. TRQ-STA) (B). (C) Comparison of up-regulated and down-regulated genes in TRQ-treated P. aeruginosa cells in the exponential growth phase (EXP) and in stationary growth phase (STA). (D) Pie charts showing the relative abundance of functional classifications of differentially expressed genes of TRQ-treated P. aeruginosa under two growth conditions. Hypothetical genes were removed from the pies to ensure ease of reading. (E) TRQ-treated P. aeruginosa regulon shared overlap with custom QS regulon. Venn diagrams showing the overlap between QS regulon and TRQ-treated P. aeruginosa cells in the exponential growth phase and in the stationary growth phase (F).

