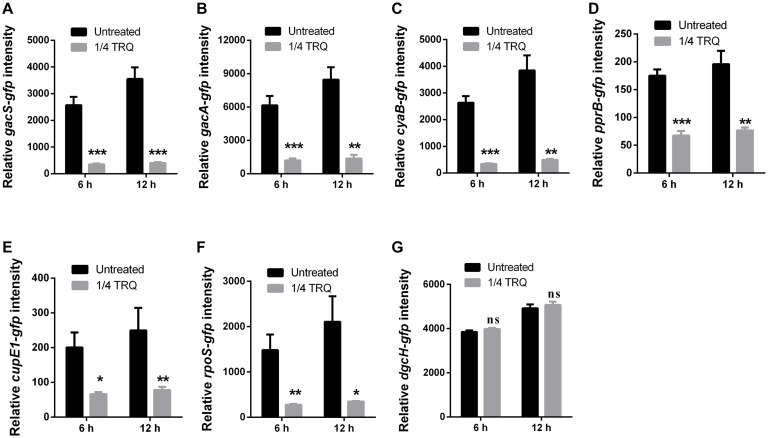
FIGURE 6.
Upstream genetic determinants of QS systems impacted by TRQ treatment. (A) gacS-gfp; (B) gacA-gfp; (C) cyaB-gfp; (D) pprB-gfp; (E) cupE1-gfp; (F) rpoS-gfp; (G) dgcH-gfp. Relative fluorescence intensity was defined by GFP intensity calibrated with OD600nm. Statistical analysis was based on pairwise comparisons (Student’s t-test). ***P < 0.001; **P < 0.01; *P < 0.05; ns, non-significant. Error bars represent the SD.

