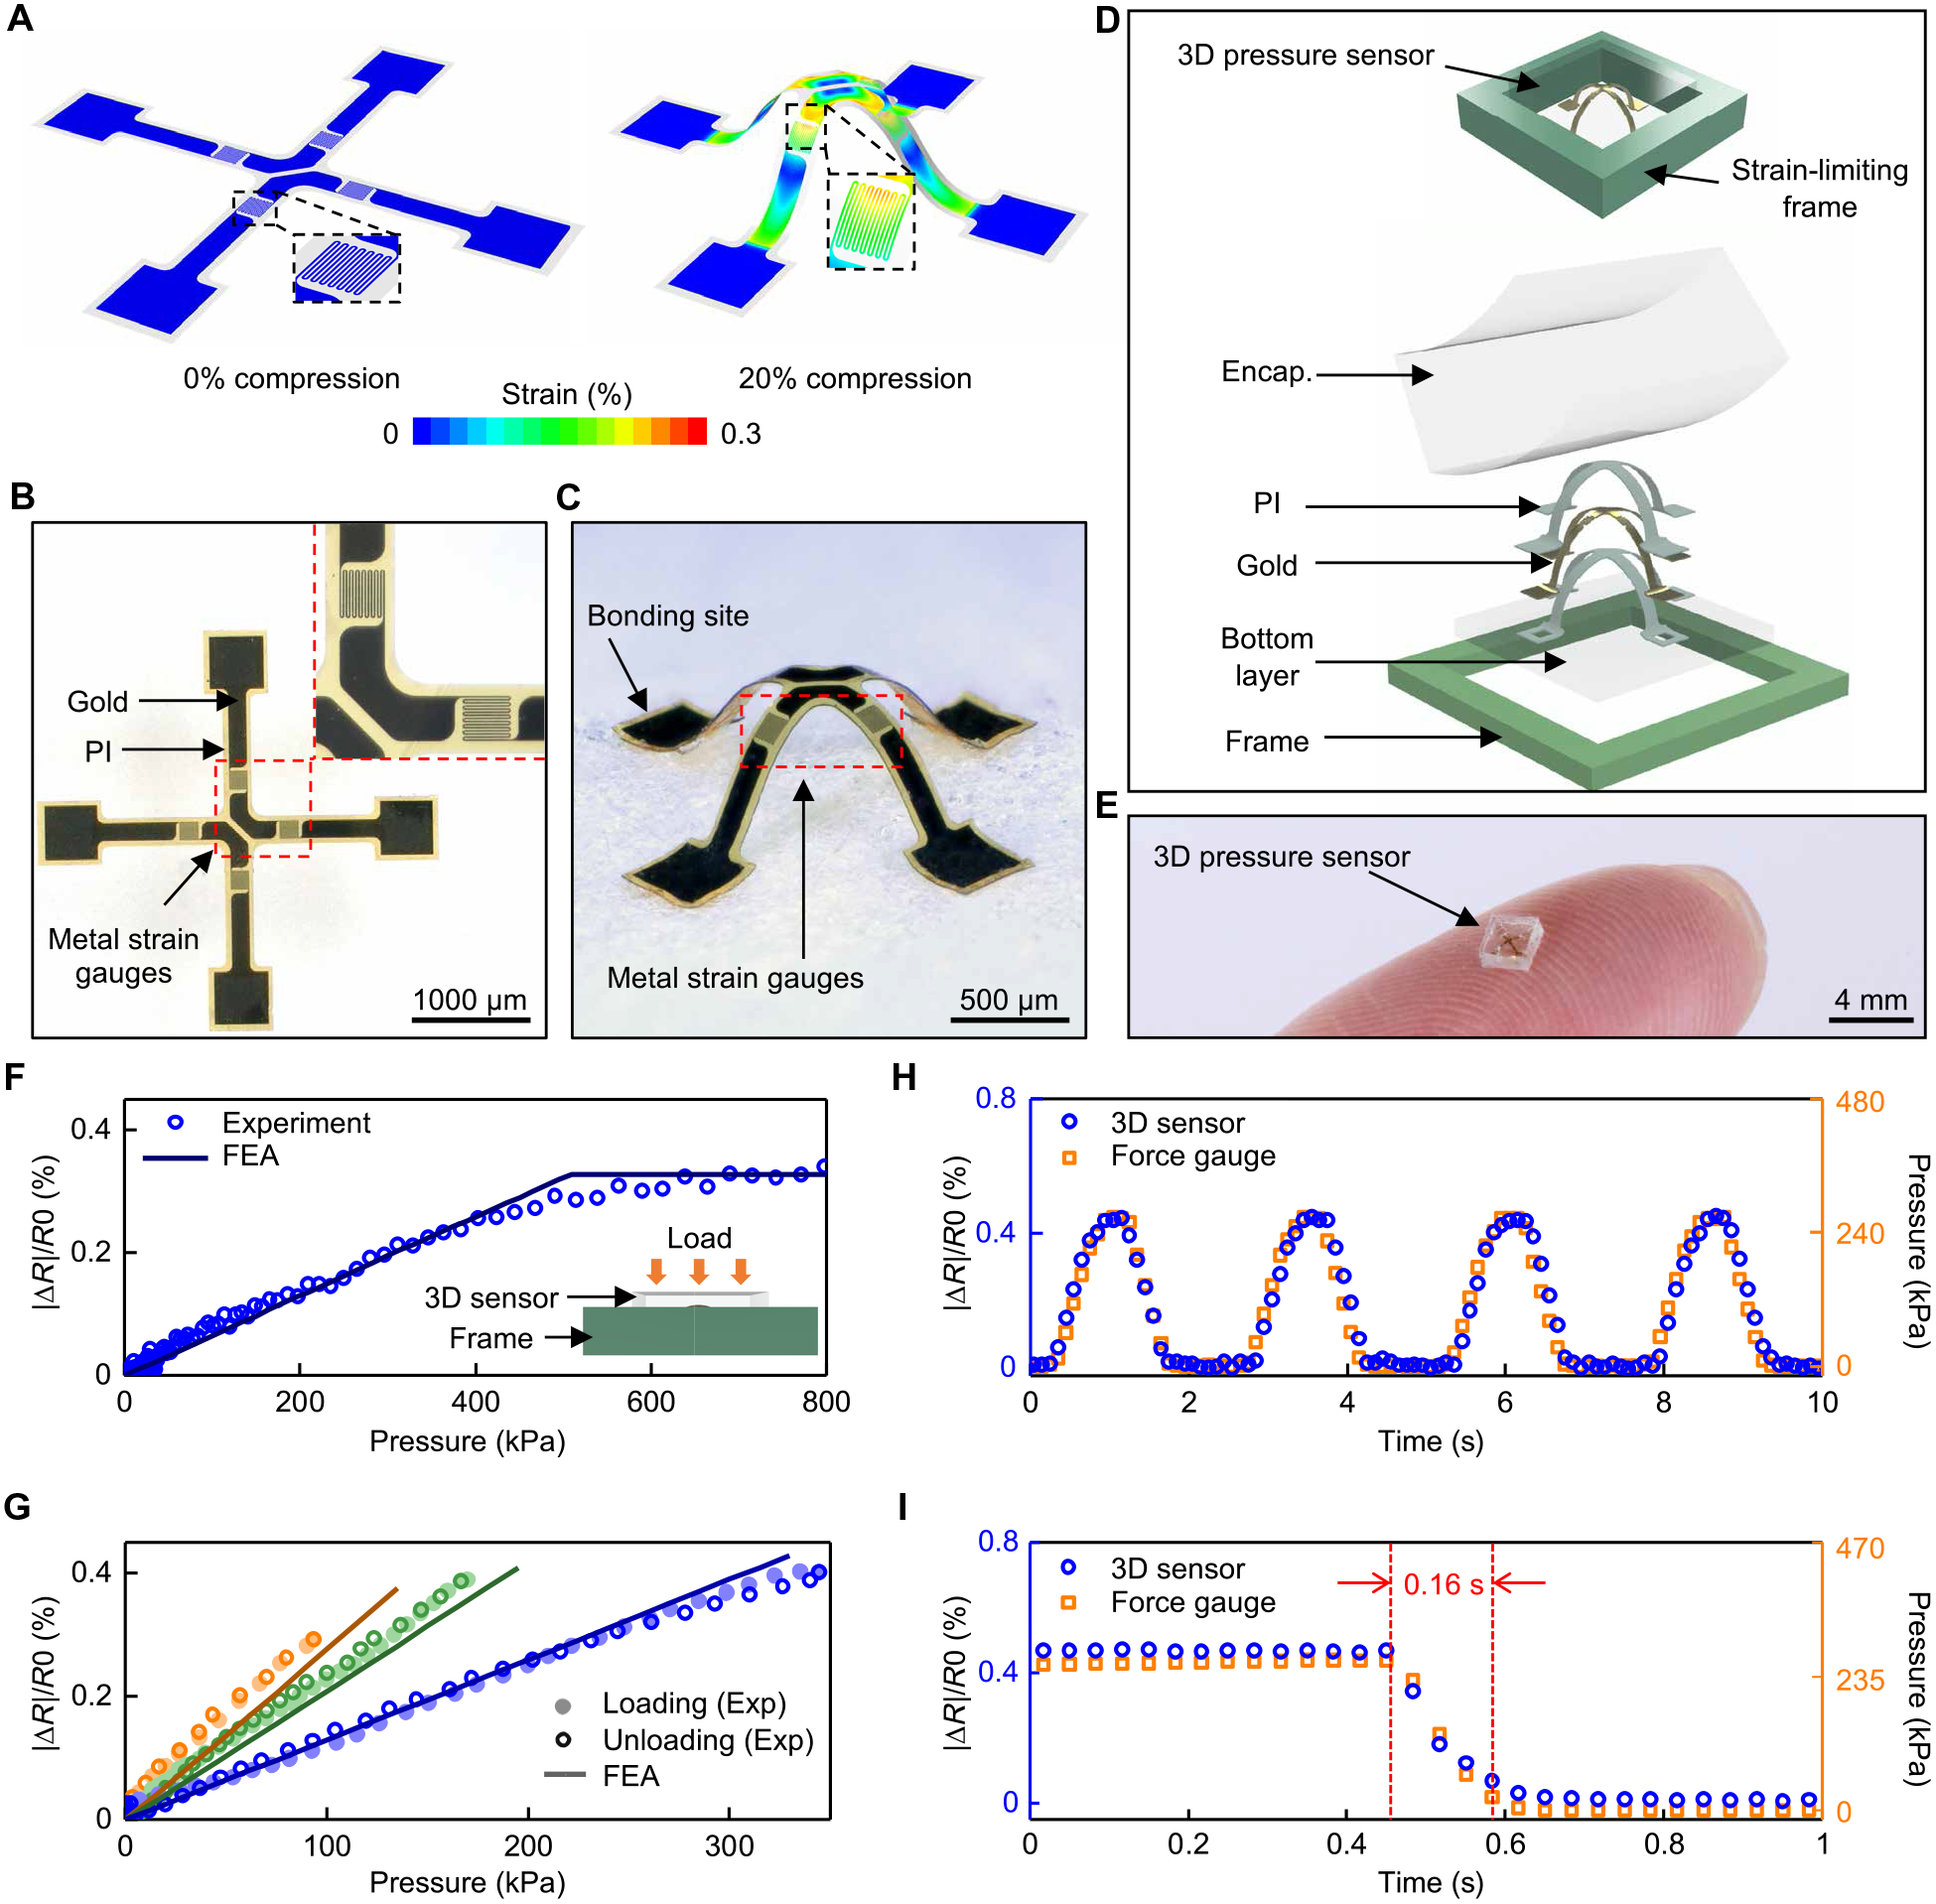
Fig. 2. Design features and performance characteristics of 3D millimeter-scale, soft pressure sensors.

(A) Simulation results for the distribution of strain in a 2D precursor before (0% compression) and after (20% compression) transformation into a 3D shape for pressure sensing. (B) Optical image of the precursor, showing patterned thin metal traces as strain gauges. The area enclosed in the red dashed line is shown at higher magnitude in the right inset. (C) Image of the 3D mesostructure formed by compressive buckling. (D) Schematic illustration (top) and exploded view diagram (bottom) of a sensor with an encapsulation (Encap.) layer and a strain-limiting frame. (E) Picture of a pressure sensor on the tip of an index finger. (F) Fractional change in resistance (|ΔR|/R) of a sensor with a strain-limiting frame as a function of applied pressure. (G) Responses of three different sensors to pressure loading and unloading. Orange: encapsulation with modulus of 2 MPa; assembly with 20% prestrain. Green: modulus of 2.6 MPa; prestrain of 20%. Blue: modulus of 2.6 MPa; prestrain of 15%. (H) Fractional change of resistance of a sensor under four cycles of loading/unloading compared to measurements using a force gauge. (I) Fractional change of resistance of a sensor during unloading of external pressure using a linear motion stage moving at a speed of 20 mm/s, compared to measurements using a force gauge.
