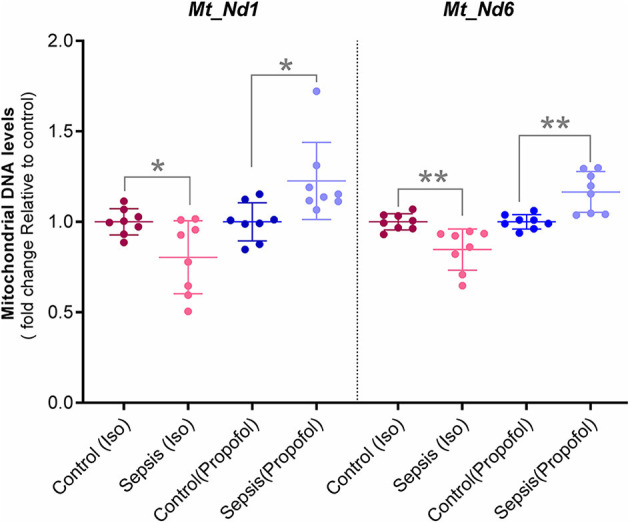
Figure 6.

Mitochondrial DNA levels quantified with qPCR: Two Mitochondrial DNA encoded genes (Mt-Nd1 and Mt-Nd6) levels was normalized to a nuclear gene (Tubulin A1) and relative mtDNA levels was expressed as fold change to controls. Decreased mtDNA at gene Mt-Nd1 (p* = 0.040) and gene Mt-Nd6 (p** = 0.003) was observed in Isoflurane +Sepsis group compared to controls which had no sepsis. Interestingly, a small increase in mtDNA, Mt-Nd1 (p** = 0.007), and Mt-Nd6 (p** = 0.003) was seen in Propofol-sepsis group. n = 7–8 animals/group; Bars are mean ± S.D.
