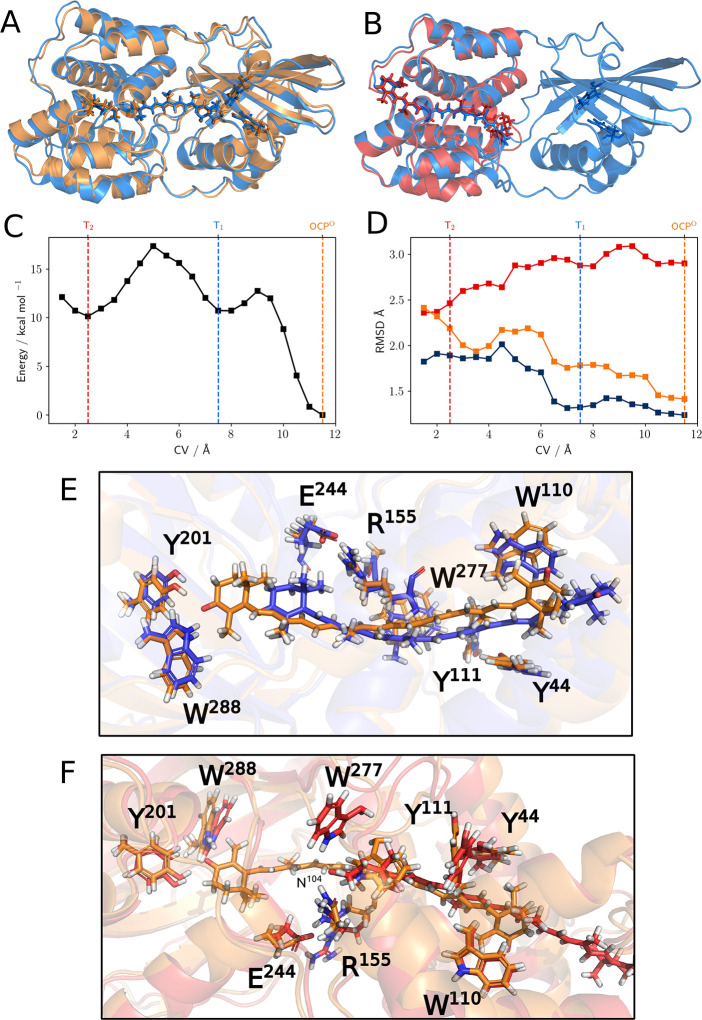
Figure 2.
(A) Average structure at CV ≈ 11.5 Å (in blue) superimposed on the crystal structure of OCPO (in orange) and (B) at CV ≈ 2.5 Å superimposed on the RCP crystal structure (in red). (C) Free-energy profile along the CV (in kcal/mol). (D) Average RMSD values (in Å) for the NTD computed using as reference the NTD of the crystal structures of OCPO (orange line) and RCP (red line) and for the CTD computed using as reference the CTD of the crystal structure of OCPO (blue line). Comparison of representative structures of OCPO and (E) T1 and (F) T2 states. A licorice representation is used for CAN and for the side chains of some relevant residues spotted either in the literature (particularly the two H-bonding Y201 and W288 and the π-stacking Y44, W110, and Y111)32 or in this present work (the interface H-bond network E244, R155, N104, and W277). In order to give a better view of the complexes, we used a different orientation in panels A and B (roughly rotated by 180° around the horizontal axis).

