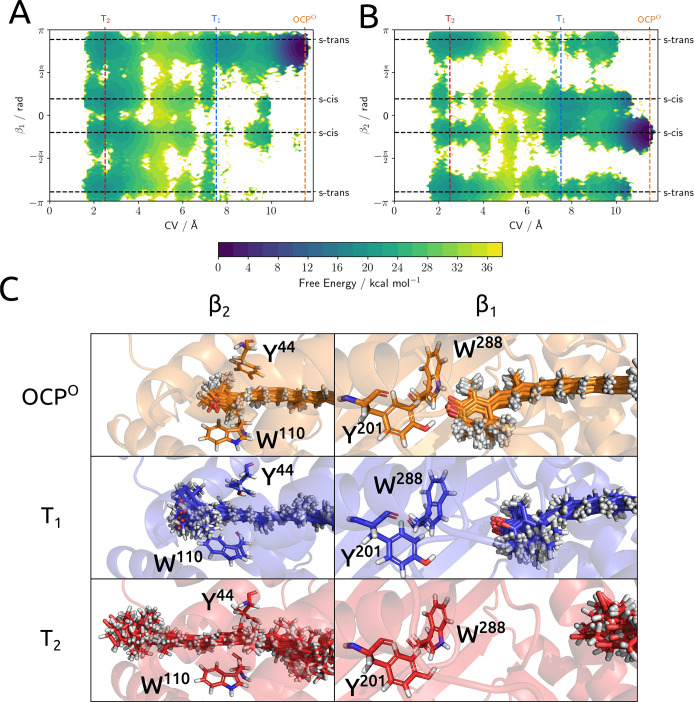
Figure 4.
Plot of the free-energy surface projected on the (A) CV-β1 and (B) CV-β2 subspaces obtained from reweighting of the US-REMD simulations. (C) Overlap of 10 configurations of CAN in T2, T1, and OCPO together with a single representation of the protein environment as a spatial reference. The upper panels show the β1 side of the carotenoid, and the lower ones, the β2 side.

