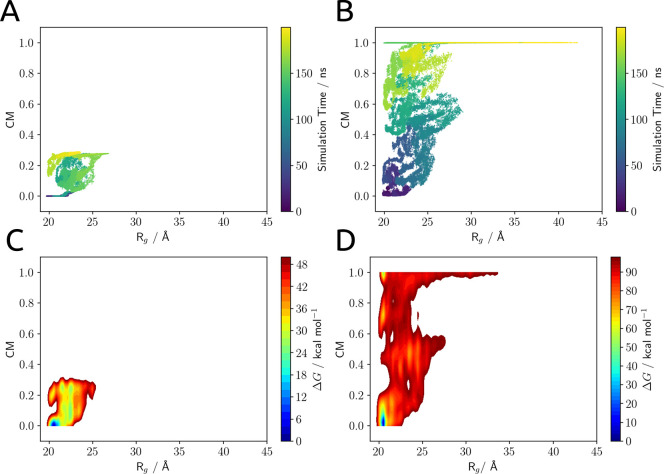
Figure 5.
(A, B) Configurations of the system sampled in the wt-MetaD simulation projected in the subspace of the biased collective variables: the radius of gyration (Rg) and the interface contact map (CM). (C, D) Free-energy surfaces for the dissociation process projected in the subspace of the biased collective variables. Plots A and C refer to the simulation started from OCPO, and plots B and D refer to the one started from T2.

