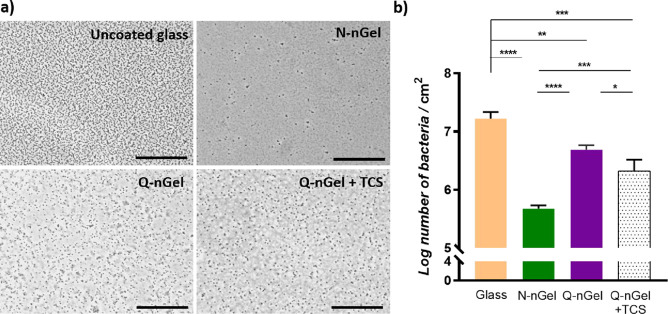
Figure 5.
(a) Images of adhered S. aureus ATCC 12600 after 2 h of flow on uncoated glass, N-nGel coating, Q-nGel coating, and Q-nGel coating+TCS. The scale bar depicts 40 μm. (b) Number of adhering bacteria after 2 h. Experiments were performed on three independent nanogel-coated surfaces and with separately cultured bacteria. Differences that are statistically significant are marked with * (p < 0.05), ** (p < 0.01), *** (p < 0.001), and **** (p < 0.0001).

