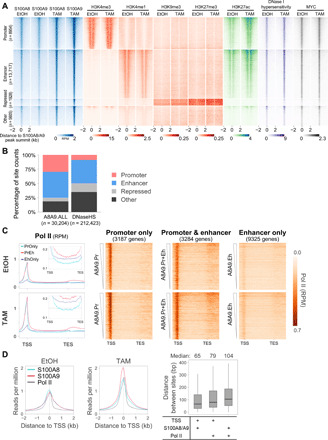
Fig. 4. Epigenomic features of S100A8 and S100A9 chromatin binding.

(A) Chromatin occupancy of indicated factors at ±2000 bp of summits of the union of all peak regions for S100A8 or S100A9 in combination with EtOH- and TAM-treated conditions. Heatmaps are segmented according to types of genomic regions as defined by patterns of histone modifications. Replicate-pooled chromatin binding data are shown for S100A8 and S100A9. Heatmaps are sorted by S100A9 ChIP signal in TAM treatment. (B) Percentage of the indicated classes of regions for all S100A8/A9 sites (A8A9.ALL) and DNase I hypersensitive sites (DNaseHS). (C) Meta-gene profiles (average, left) and heatmaps (right) of Pol II association from 1 kb upstream of transcription start site (TSS) and 2 kb downstream of transcription end site (TES) at indicated groups of S100A8/A9 target genes in EtOH and TAM treatment. Insets show Pol II signal at coding region; dash lines are aligned to 0.15. Heatmaps are sorted by S100A8/A9 ChIP signal density (±250 bp of peak summit) at sites at promoters (Pr), enhancers (Eh), or both (Pr + Eh). (D) Location of S100A8, S100A9, and Pol II signals with respect to the TSS along with box plots indicating the distance between pairwise combinations.
