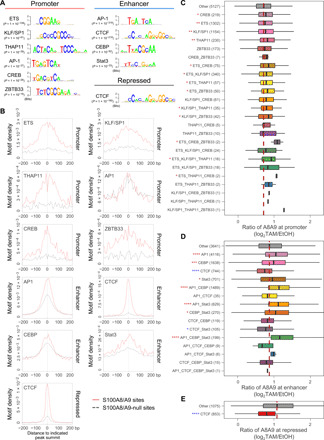
Fig. 6. Motif enrichment and S100A8/A9 chromatin binding.

(A) De novo identified DNA motifs at S100A8/A9 sites at the indicated classes of genomic regions highly matched to known motifs. The de novo motif search was performed for S100A8/A9 sites against DNase I hypersensitive sites lacking S100A8/A9 association (S100A8/A9-null sites) in the same class of chromatin regions. Hypergeometric P values for motif enrichments are shown. (B) Distributions of de novo discovered motif density at ±200 bp of the indicated peak summits of indicated classes of chromatin regions. (C) TAM-induced fold changes of S100A8/A9 chromatin binding at S100A8/A9 sites with or without indicated motifs (alone or in combination) in promoter regions. *P < 0.05, **P < 1 × 10⁻⁵, ***P < 1 × 10⁻¹⁰, and ****P < 2.2 × 10⁻¹⁶ compared with S100A8/A9 sites without indicated motifs (other); Wilcoxon rank sum test. Asterisks (*) for increased fold change were colored red or otherwise colored blue. Peak numbers of indicated groups are shown in the parentheses. The dashed line is aligned to median value of the Other group. (D) Same as (C) for sites at enhancer regions. (E) Same as (C) for sites at repressed regions.
