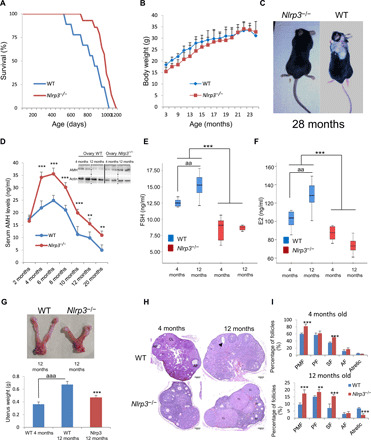
Fig. 2. NLRP3 signaling suppression in mice extends life span and improves hormonal status in female mice.

(A) Kaplan-Meier graph showing a significant increase in n that pertains to the maximum life span in WT mice compared with Nlrp3−/− mice. (B) Body weights of the groups over time. (C) Representative photographs of 28-month-old mice. (D) Mean serum AMH levels by enzyme-linked immunosorbent assay (ELISA) and ovarian AMH protein levels (top) measured by Western blot (WB) to evaluate the progression of ovarian reserve during aging in WT mice compared with Nlrp3−/− mice. On top, ovarian AMH protein levels. (E and F) Analysis of serum concentrations of FSH and E2 measured by ELISA. N = 8 per group. (G) Representative images showing comparative size and weights of uterine horns in WT and Nlrp3−/− mice. (H and I) Representative micrographs of 4- and 12-month-old WT and Nlrp3−/− ovarian sections. The number of ovarian follicles at developmental stages [primordial follicle (PMF), primary follicle (PF), secondary follicle (SF), and antral follicle (AF); asterisks in the image, PMF and arrowhead, atretic follicle] was assessed in every fifth serial section of WT and Nlrp3−/−. N = 15 to 20 per group. Data are shown as means ± SD. **P < 0.005, ***P < 0.001, aaaP < 0.001, Nlrp3−/− versus WT mice; aaP < 0.01, 4-month-old versus 12-month-old mice. Photo credit: Beatriz Castejón-Vega, Institute of Molecular, Cell and Systems Biology, University of Glasgow (C); Mario D. Cordero, Cátedra de Reproducción y Genética Humana del Instituto para el Estudio de la Biología de la Reproducción Humana (INEBIR)–Universidad Europea del Atlántico (UNEATLANTICO)–Fundación Universitaria Iberoamericana (FUNIBER) (G).
