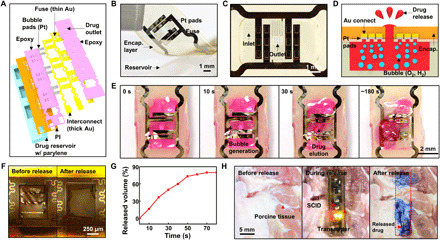
Fig. 3. Drug release from the SID.

(A) Exploded schematic illustration of the backside of the SID to show its design. (B) Image of the lid and reservoir of the SID. (C) Magnified view with an optical camera image of the drug inlet and outlet of the SID. (D) Schematic illustration of the drug release process using the water electrolysis. (E) Time-lapse optical camera images of the drug release process. (F) Images of the fuse before (left) and after (right) the drug release. (G) Drug release profile from the SID in vitro. (H) Images of the drug release on porcine tissues ex vivo (left, before drug release; middle, during wireless power supply to the SID; right, after drug release). Evans blue was used as a model drug for easy visualization of the released drug. Photo credit: Hyunwoo Joo, Seoul National University.
