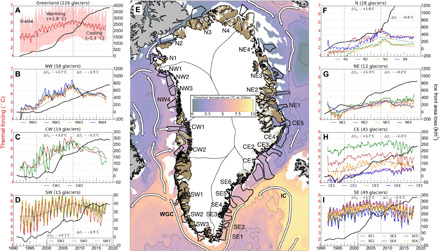
Fig. 1. Regional comparison of ocean TF and glacier retreat during 1992–2017.

The reconstruction of ocean TF (°C)—the depth-averaged difference between the in situ water temperature and the salt- and pressure-dependent freezing point of seawater—and cumulative glacier retreat (, square kilometer) is shown for (A) all 226 marine-terminating glaciers (red; ±1σ of all regions), respectively, (B) northwest (NW), (C) central west (CW), (D) southwest (SW), (F) north (N), (G) northeast (NE), (H) central east (CE), and (I) southeast (SE) Greenland. Linear regressions in TF through stable, warming, and cooling periods are identified as three thin black lines. (E) Sample areas (thick black, numbered by region) used to evaluate TF in seven regions, with major ocean currents (white), overlaid on a reconstruction of potential temperature at 257-m depth from the MITgcm ocean model for November 2005 (3). IC, irminger current; WGC, west greenland current.
