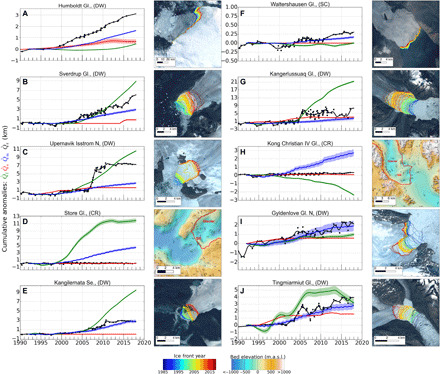
Fig. 4. Summary of cumulative anomalies at the glacier terminus for ten examples.

(A to J) Example glaciers for the seven regions showing time series of observed ice front retreat, (black), retreat induced by surface thinning, (red), and cumulative anomalies in undercutting by the ocean (blue) and in ice advection, (green), for 1992–2017. Second and fourth columns show the ice front location color coded from 1992–2017 overlaid on Landsat 8 imagery or bed elevation. Note that the vertical axis is scaled differently for each example.
