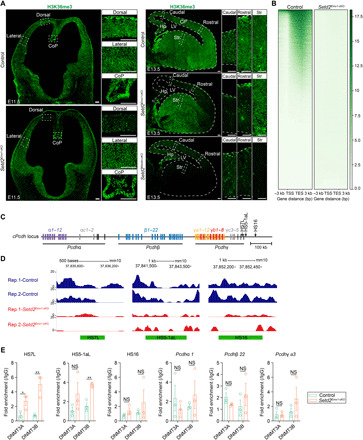
Fig. 5. H3K36me3 modifications are reduced in cis-regulatory sites of cPcdh genes in Setd2Emx1-cKO cortices.

(A) H3K36me3 immunofluorescence on E11.5 (left) coronal and E13.5 (right) sagittal brain sections. Boxed regions were enlarged on the right. (B) ChIP-seq density heatmaps in E13.5 control (n = 2) and Setd2Emx1-cKO (n = 2) cortices. Plots depicting H3K36me3 signals from 3 kb upstream of the transcription start site (TSS) to 3 kb downstream of the transcription end site (TES). Each line in a heatmap represents one gene. (C) Genomic structure of cPcdh genes on mouse chromosome 18. Deoxyribonuclease (DNase) I hypersensitive sites (HS) are indicated as black arrows. (D) H3K36me3 levels at three HS elements in E13.5 control and Setd2Emx1-cKO cortices. The green frame shows the HS position and size. (E) ChIP-qPCR analyses showing DNMT3A/B binding to the HS region and promoters of cPcdh locus in E13.5 dorsal cortices. Quantification of enrichment was displayed as fold enrichment over immunoglobulin G (IgG) controls (n = 3 animals for each genotype). *P < 0.05 and **P < 0.01. Data are represented as means ± SEM. Scale bars, 100 μm. CoP, commissural plate.
