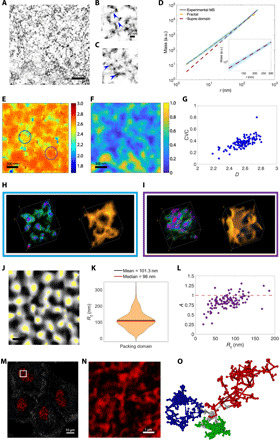
Fig. 2. nano-ChIA identifies fractal PDs.

(A) Virtual 2D slice from ChromSTEM HAADF tomography reconstruction of chromatin from an A549 cell nucleus (contrast inverted). (B and C) High-resolution tomography reveals fine chromatin structures such as (B) linker DNA and (C) individual nucleosomes. (D) Average chromatin mass scaling shows two power-law scaling regimes fit with linear regression in log-log scale: the fractal PD regime (r < 102.4 nm; yellow dashed line) and the nonfractal supra-domain regime (r > 102.4 nm; red dashed line). Inset: Magnification of (D) highlighting the supra-domain regime. (E and F) Corresponding mapping of (E) D and (F) CVC of an A549 cell. (G) Relationship between D and CVC. (H and I) Supranucleosomal packing configurations for two PDs with different Ds highlighted in (E) by (H) the blue circle and (I) the purple circle. In the leftmost rendering of each panel, the DNA concentration increases from green to red. The rightmost rendering shows the surface topology. (J) Segmentation of D mapping. Identified PDs are in white, and the center regions of PDs, as determined by the flooding algorithm, are in yellow. (K) Distribution of PD radii (Rf), defined as the upper bound of the fractal regime of the mass scaling (MS) curve. (L) Dependence of packing efficiency factor A on Rf. Red dashed line denotes A = 1, which represents optimal packing. (M and N) PWS D mapping of several cells with nuclei shown in red. (N) PWS D mapping corresponding to the inset in (M). Each red cluster represents a diffraction-limited observation of PDs. (O) Rendering of three spatially separable PDs (green, blue, and red) with distinct packing scaling behavior.
