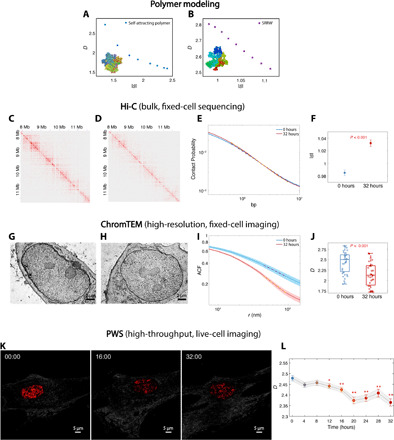
Fig. 3. Relationship between s and D.

(A and B) A general inverse relationship between s and D is demonstrated using (A) self-attracting polymer and (B) SRRW simulations. (C and D) Hi-C contact maps for BJ cells treated with DXM treatment for (C) 0 hours and (D) 32 hours. (E) Intrachromosomal contact probability plotted against genomic distance in log-log scale. (F) s for BJ cells treated with DXM for 0 and 32 hours. The linear regression fit was performed on contact probability versus genomic distance between 105.8 and 106.8 bp. (G and H) ChromTEM images of BJ cells (G) without and (H) with DXM treatment for 32 hours. (I) The average ACF of chromatin mass density for untreated cells (blue) significantly differs from that of treated cells (red). D was measured inside the fractal PD (50 to 100 nm) by a linear regression fit of the ACF in log-log scale. (J) Using ChromTEM ACF analysis on fixed cells, an increase in D was observed after the 32-hour DXM treatment (N = 31 cells per condition; P < 0.001). (K and L) Live-cell PWS analysis of BJ cells treated with DXM. (K) PWS images of BJ cells with DXM treatment at 0-, 16-, and 32-hour time points. (L) Time course PWS measurements showed a significant decrease in D for all time points after 12 hours (N > 67 cells; *P < 0.05 and **P < 0.001) compared to the 0-hour time point.
