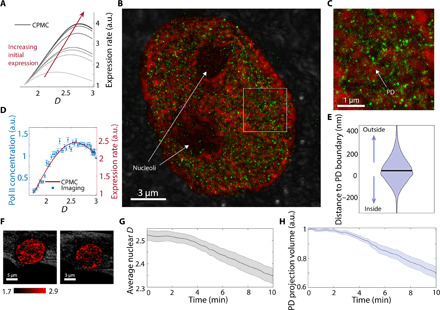
Fig. 4. nano-ChIA platform investigates the relationship between chromatin structure and transcription.

(A) Multiple realizations of the CPMC model with varying molecular conditions for low- and high-expression genes show that in all cases, the surrounding chromatin packing scaling has a nonmonotonic relationship with gene expression. (B) STORM image of an M248 ovarian cancer cell with labeled active RNAP II (green) overlaid on top of chromatin packing scaling D map measured by PWS (red). (C) A magnified view of the white square in (B). (D) The relationship between D (chromatin packing scaling) and the local concentration of active RNAP II (gene expression level) (N = 4 cells) compared with one realization of the CPMC model. (E) A violin plot shows the distribution of distances between enriched Pol II regions and their nearest PD. The plot shows that active RNAP II tends to distribute around the boundary of PDs (N = 4 cells). (F) PWS imaging of a live BJ fibroblast cell during Act-D treatment. The pseudocolor is coded by the D values inside the nuclei. (G) After transcriptional elongation is halted with Act-D, average nuclear chromatin packing scaling decreases steadily within minutes as measured by PWS (P < 0.001 comparing t = 0 and 10 min). (H) The change in the volume fraction of the nucleus containing PDs as measured by PWS (P < 0.001 comparing t = 0 and 10 min).
