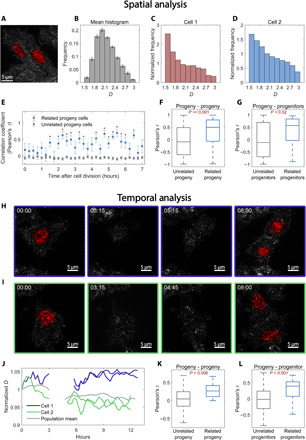
Fig. 5. Time-resolved PWS imaging of HCT116 cells determines heritability of chromatin packing scaling for N = 10 progenitor cells and N = 20 progeny cells.

(A) PWS D map of two progeny cells originating from the same progenitor. (B) Average spatial D distribution of all cells imaged 5 hours after cell division. (C and D) Histogram ratio of the spatial D distribution for each individual progeny cell [from (A)] normalized by the average histogram of all cells at that time point [from (B)]. (E) After cell division, the normalized histograms of paired progeny cells are more highly correlated with each other than with unrelated progeny cells at the same time point (*P < 0.05). (F) Across all time points, normalized histograms of paired progeny cells are more significantly correlated compared to those of unrelated progeny. (G) Comparing all progeny cells 3 hours after division to all progenitors 3 hours before division shows that progeny cells have a higher correlation with their “parent” than with unrelated progenitors (P = 0.021). (H and I) PWS D maps at four time points before, during, and after cell division. During cell division, nuclei exit the objective’s depth of field by lifting off the glass and return to the glass when they have finished dividing. (J) Average nuclear D tracked over time [from cells in (H) and (I)]. After ~5 hours, both cells have finished dividing, and their progeny cells were tracked for an additional ~7 hours. (K) D of progeny cells is more strongly correlated with that of their paired progeny than with other unrelated cells (P < 0.001). (L) Progeny cells are more correlated with their parent progenitor cells than with other unrelated cells.
