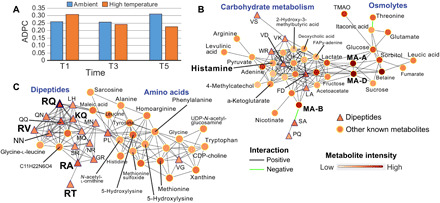
Fig. 4. Network analysis of M. capitata metabolites.

(A) ADPC scores for ambient and thermal treatments at T1, T3, and T5. (B) Subnetwork at thermal stress T5 showing the relationship between carbohydrate metabolism and osmolyte accumulation. Dipeptides are shown as triangles (under both positive and negative ionization modes), and other metabolites are shown as circles with annotations, when available. Metabolite intensity and type of correlation are shown in the legend. (C) Subnetwork at thermal stress T5 showing the relationship between dipeptide and amino acid accumulation.
