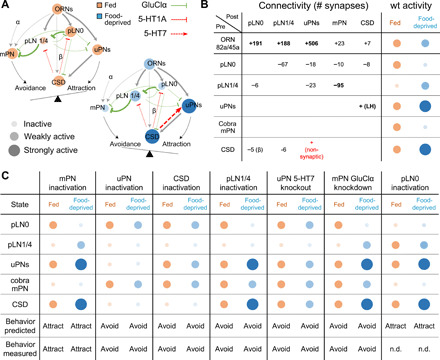
Fig. 4. A simple dynamical model recapitulates state-dependent changes in odor valence.

(A) Connectivity and state-dependent dynamics of lAL model. Each node represents a cell type; node size and intensity represent the predicted activity in fed (orange) and food-deprived (blue) states. Edges terminating in arrowheads and bars represent excitatory and inhibitory connections, respectively; edge thickness indicates connection strength. (B) EM-derived synapse counts between all modeled cell types and model predictions for neuronal activity in the fed (orange) and food-deprived (blue) states. Assignment of excitatory (+) or inhibitory (−) sign to each connection is based on experimental data. The positive connection from CSD to uPNs models the effect of putatively nonsynaptic 5-HT release. We also assume excitatory feedback from uPNs to CSD via the lateral horn (LH). Connections with ≥25 synapses are assigned weight 1, and connections with <25 synapses are assigned weight w < 1. The weak connection from CSD to pLN0 is assigned weight β. wt, wild type. (C) Model predictions for activity of each cell type and overall behavioral output in the fed (orange) and food-deprived (blue) states under simulated perturbations. All model predictions are corroborated by experimental results except for the case of pLN0 inactivation (n.d., no data).
