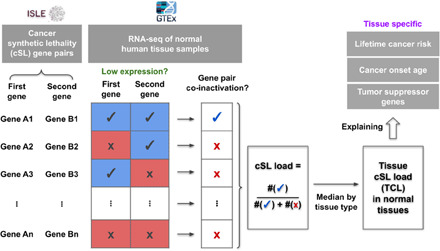
Fig. 1. A schematic diagram providing an overview of this study.

This diagram illustrates the computation of cSL load for each sample and each tissue type (i.e., TCL) and depicts the outline of this study, where we attempted to explain the tissue-specific lifetime cancer risk, cancer onset age, and TSGs using TCL. See main text and Methods for details.
