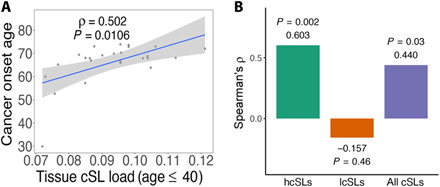
Fig. 3. TCL can explain the variance in cancer onset age across human tissues.

(A) Scatterplot showing Spearman’s correlations between cancer onset age and TCL (age ≤40 years). (B) Bar plot showing the correlations between cancer onset age with TCLs computed (age ≤40 years) using subsets of cSLs: hcSLs, lcSL, and all cSLs. Spearman’s ρ and P values are shown. As in Fig. 2D, this analysis was done for a subset of GTEx normal tissues for which we had matched TCGA cancer types to identify the hcSLs and lcSLs (Methods); therefore, the correlation result for all cSLs is also different from that in (A).
