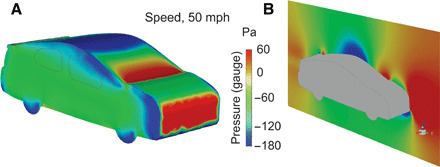
Fig. 2. Pressure distributions around the exterior of the car associated with a vehicle speed of 22 m/s (50 mph).

(A) Surface pressure distribution. (B) Pressure distribution in the air at the midplane. The color bar shows the gauge pressure in pascals and emphasizes the midrange of pressures: [−180, 60] Pa. At this speed, the full range of gauge pressure on the surface is [−361, 301] Pa.
