
Fig. 1. Identification of NIR dye for leukemia cell targeting.
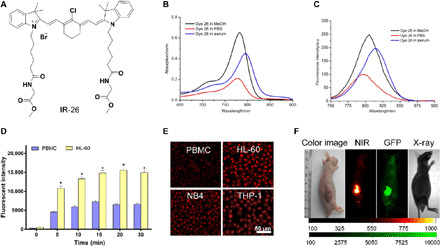
(A) Chemical structure of IR-26. (B) Absorption spectra of 2 μM IR-26 in 10% FBS, methanol (MeOH), and PBS. (C) Fluorescence emission spectra of IR-26 in 10% FBS, methanol (MeOH), and PBS. a.u., arbitrary units. (D) NIR fluorescence intensity in human peripheral blood mononuclear cells (PBMCs) and HL-60 cells was compared after incubation with the same concentration of IR-26 for various times (n = 3). MitoTracker Green was used to avoid the impact of cell size in comparing fluorescence of PBMCs to AML cells. (E) PBMCs and AML cell lines (HL-60, NB4, and THP-1) were incubated with IR-26 for the same condition and imaged by a laser confocal scanning microscope (Leica) with 633-nm excitation. (F) Preferential accumulation of IR-26 in athymic tumor-bearing nude mice preestablished with GFP-labeled HL-60 tumor xenografts. The animals were subjected to fluorescence imaging and x-ray imaging using Kodak In-Vivo Imaging System FX Pro (New Haven, CT). Photo credit: Tao Liu, Institute of Rocket Force Medicine, Third Military Medical University. Error bars denote means ± SD. *P < 0.05.