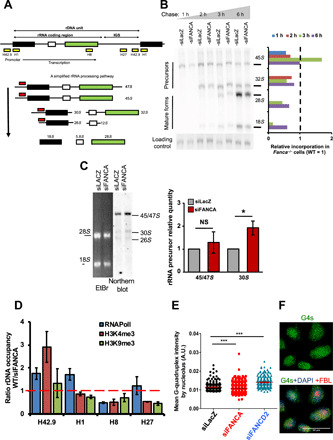
Fig. 3. rDNA transcription and rRNA processing in FANCA-deficient cells.

(A) Top, rDNA repeat organization. Yellow boxes indicate regions amplified by ChIP-qPCR analysis: promoter, H42.9; starting codon, H1; and final part, H8, of the RNAPolI-transcribed region, and the inter-rDNA gene sequence H27 (IGS). Bottom, pre-rRNA processing paths. Red boxes indicate probes used in the Northern blot analysis. (B) Experiment showing precursor and mature rRNAs. At 72 hours after transfection, HeLa cells were labeled (20 min) with [32P]orthophosphate and chased with cold orthophosphate for the indicated time. The EtBr-stained gel is shown as a loading control. Right, relative level of different rRNA forms in siFANCA-transfected cells normalized versus the FANC-proficient cells. (C) Northern blot analysis performed with the probe indicated in (A). RNAs were isolated 72 hours after siRNA transfection of HeLa cells. The EtBr-stained gel is shown as a loading control. The quantity measured in FANCA-depleted cells was adjusted to that in FANCA-proficient cells, which was set to 1. Bars represent the mean of four independent experiments ± SEM. Statistical significance was assessed with one-tailed Student’s t tests (*P < 0.05). (D) Ratio WT/siFANCA of the distribution of RNAPolI, H3K9me3, and H3K4me3 on the rDNAs of HeLa cells, as determined by ChIP-qPCR analysis. ChIP was performed 48 hours after siRNA transfection. Bars represent the mean of three experiments ± SEM. (E and F) Cells costained with anti-G4 (green), anti-FBL (red), and DAPI (blue). Dots in the diagram represent the intensity of G4 staining measured using CellProfiler software inside the nucleoli for each cell 48 hours after transfection with the indicated siRNAs. At least 100 cells were scored for each condition. Statistical significance was assessed with a Z (normal distribution) test (***P < 0.005).
