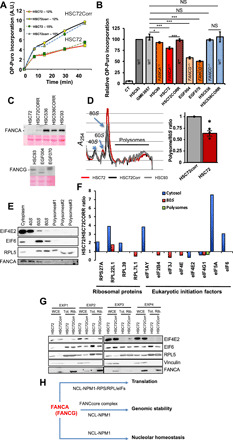
Fig. 5. FANCA deficiency leads to an altered ribosome profile and reduced protein synthesis.

(A) Time-course incorporation of OP-Puro assessed by FACS in FANCA lymphoblasts (HSC72) and their corrected counterpart (HSC72Corr) cultured in 12 or 15% FCS. (B) Relative levels of OP-Puro incorporation in FANC-proficient (HSC93 and GM3657), FANCA−/− (HSC72 and HSC99), FANCC−/− (HSC536), or FANC-corrected lymphoblasts. Bars represent the mean of three to five independent experiments ± SEM. The value observed in HSC93 cells was set to 1 in each individual experiment. Statistical significance was assessed with a two-tailed Student’s t test against the GM03657 cell line (*P < 0.05 and ***P < 0.005). (C) Western blot showing the expression of FANCA and FANCG in the indicated cell lines. (D) Polysome profiling in FANCA-deficient HSC72 and FANCA-proficient HSC72corr and HSC93 lymphoblasts and quantification of the polysome/monosome ratio in HSC72 relative to HSC72corr cells. Bars represent the mean of four independent experiments ± SEM. The value of the HSC72corr cell was set to 1 in each individual experiment. (E) Western blots showing FANCA presence in the ribosomal-enriched cytoplasmic, 40S, 60S, and monosome (80S) fractions. (F) Histograms representing the mean expression level of the indicated proteins in the cytosol, 80S, and polysomes in FANCA-deficient cells compared with their corrected counterparts. Data are from MS analysis. (G) Western blots showing the expression of the indicated proteins in whole-cell (WCE) and ribosomal-enriched (Tot. Rib.) extracts in HSC72 and HSC7CCorr cells in four experiments. (H) Simplified diagram illustrating the several roles of FANCA in cell physiology.
